Top
Industry 40 ResearchCOVID-19 Pandemic Mitigation Products Market – 2020-2024
COVID-19 Report Cover
NEW

COVID-19 Pandemic Mitigation Products Market - 2020-2024

More Than* $250 Billion / Annum. 212 Submarkets. 2 Scenarios. 

  • June 2020
  • 1020
  • 728
    • 5950 $
    • 6950 $
    • 8950 $
    • 12000 $

    Small Businesses, Startups & Academia - Up to 50% Off

Quantity
University of Waterloo
Toshiba
University of NSW
Samsung Electronics
Recruit
Mitsubishi Electric
KUKA
KRISS
Fujitsu
API Technologies
HP
Amazon
Sandia National Lab
HITACHI
Thales

Want to customize this report?

If you purchase this report, you are entitled to a 30% discount towards customizing it, to better fit your market research and strategic needs. Our Custom Research and Industry Insights Department will work with you to better understand your information gaps and strategic needs and will provide you with a tailor-made market research report within a short period of time.

Why Choose Us?

30+ Years of Experience
We are a multidisciplinary team of homeland security and public safety industry experts with over 30 years of experience.
Gold Standard
With over 950 private sector clients (73% repeat customers), including major defense and security vendors, and Forbes Global 2000 companies, HSRC earned the reputation as the industry’s Gold Standard for Homeland Security & Public Safety Market Reports.
Tailored Research Services
Provide you with clear, actionable recommendations designed to empower decision making and to help you exploit emerging opportunities in the homeland security & public safety industries.
Information Security
Your personal information is safe and secure.

From: $5,950

SKU: 20536 Categories: , Tags: , , ,

Description

COVID-19 Pandemic Mitigation Products Market – 2020-2024 Report

Why trust and read this report?

No one would have believed us if last Christmas we would have said that during April & May 2020 a devastating pandemic would kill every 10 days 58,000 people, as much as the total number of Americans killed during the ten-year Vietnam war. It devastated the global economy and created an unpredicted mega market.


During April-May, every 35 hours COVID-19 killed 2,430 Americans, more than the total Americans killed (2,403) in the Pearl Harbor attack… No wonder we will invest whatever it takes to eradicate this pandemic


As early as January 20, 2020 we recruited all our analysts to research the COVID-19 pandemic mitigation related products purchases. We interviewed hundreds of experts, participated in more than 95 conferences and webinars, reviewed more than 1,500 publications and interviewed executives of more than 65 pandemic related companies. 

The COVID-19 Mitigation Market Is a Seller’s Market… This does not Happen Very Often. 


The team which composed this report brings 43 years of hands on record in the development and commercialization of healthcare products including: antibody antigen detection, E-health, decontamination and biosecurity, PACS, teleradiology, PPE, computerized tomography, medical devices and more. Our team members bring long term relations with the U.S. FDA and CDC as well as the EU CE and other national medical regulatory agencies.

COVID-19 Pandemic Mitigation Products & Services Market Segmentation Vectors

5 Regions, 13 National Markets, 6 Vertical Markets, and 4 Revenue Source Markets:

COVID-19 Market Regions_Countries_Verticals_Revenue_Sources 

54 Products and Services Markets:

COVID-19 Market Products and Services - Part I 
COVID-19 Market Products and Services - Part II 


We found that this virus has created a new market worth $251-$459 Billion* per annum – the COVID-19 Pandemic Mitigation Products and Services market. To adhere to our high standards of research, as nobody can forecast the future of the pandemic, we include in the report two scenarios:

  1. Optimistic scenario – assumes (among other things) that mass vaccination will commence by July 2021
  2. Conservative scenario – assumes (among other things) that no mass vaccination will be available until 2025


Cumulative 2020-2024 Market: $1.38 Trillion (Scenario A); $1.94 Trillion (Scenario B) 


According to the COVID-19 Pandemic Mitigation Products Market – 2020-2024 report scenarios, the 2020-2024 cumulative market size is expected to be $1.4-$1.9 Trillion. The U.S. and Chinese markets will dominate the global one during the forecast period.


The 2024 COVID-19 Pandemic Mitigation Products Market (Scenario A), by Region

The 2024 COVID-19 Pandemic Mitigation Products Market (Scenario A), by Region


This 1020-page 5 volume market report is the first and most comprehensive review of the global COVID-19 Pandemic Mitigation Products & Services market available today. The objective of this report is to provide today’s strategic decision-makers with an expert 360-degree, time-sensitive, detailed view of this interconnected market.


The COVID-19 Pandemic Mitigation Products Market – 2020-2024 report presents a thorough market analysis of 54 products & services, 6 vertical, 4 revenue source, 5 regional and 13 national markets. Furthermore, the report provides updated extensive data of 37 key vendors.


As countries start to re-open, and you do your best to recover your business, the report brings to your attention multi-billion business opportunities that may assist your struggle to retain business continuity and growth. This newly formed market is not limited to the healthcare supplier’s industry; many business opportunities are being created for industries from geo-surveillance to blockchain, from AI, big-data & deep learning to nonwoven fabrics.


Why Buy this Homeland Security Market Report?


A. Questions answered in this report include:

  • What is the COVID-19 Pandemic Mitigation Products & Services market size and what are the forecasted trends during 2020-2024?
  • What are the most attractive business opportunities?
  • What drives the customers to purchase solutions and services?
  • What are the COVID-19 Mitigation technology & services trends?
  • What is the 212 sub-markets size over the 2020-2024 period?
  • What are the challenges to market penetration & growth?


B. The COVID-19 Pandemic Mitigation Products Market size data is analyzed via 5 independent key perspectives.

With a highly fragmented market we address the “money trail” – each dollar spent in the global COVID-19 Pandemic Mitigation market is analyzed and crosschecked via 5 orthogonal viewpoints:


  • By 54 Products and Services:
  1. Vaccines
  2. Therapeutic Drugs
  3. Other COVID-19 Pharma Industry Products
  4. PCR Instrumentation & Software
  5. Robotic PCR Systems & Software
  6. PCR Reagents & Consumables
  7. Nose & Mouth Swabs
  8. Self-collection PCR Test Kits
  9. Serologic Test Kits
  10. Standoff Thermometry
  11. X-Ray Procedures
  12. CT Procedures
  13. Ultrasound Procedures
  14. FDG-PET/CT Procedures & Wastewater Testing
  15. PACS & Teleradiology
  16. Medical PPE Gowns
  17. Medical Gloves
  18. Medical  Face Masks
  19.  Medical Face Shields
  20. Medical Eye Protection
  21. PPE Sterilization: Systems & Consumables
  22. Hand & Surface Sanitizers
  23. Decontamination
  24. Other Personal Protection Gear
  25. AI, Big Data & Deep Learning
  26. Homecare IT
  27. Geo-Surveillance Systems & Services
  28. E-Health
  1. Blockchain Technologies
  2. Other ICT
  3. Noninvasive Ventilators
  4. Invasive Mechanical Ventilators
  5. Next Generation Ventilators
  6. COVID-19 Homecare (HW, SW, Services)
  7. Portable Ventilators
  8. Surge Capacity Hospitals & ICUs
  9. Kidney Dialysis
  10. Extracorporeal Membrane Oxygenation Procedures
  11. Other Intensive Care Modalities
  12. PPE Gowns Manufacturing Plants
  13. Gloves Manufacturing Plants
  14.  Face Masks Manufacturing Plants
  15.  Face Shields Manufacturing Plants
  16. Serologic Test Kits Manufacturing Plants
  17. Melt-Blown PPE Fabric Manufacturing Plants
  18. Spun-Bond PPE Fabric Manufacturing Plants
  19. Self-collection PCR Test Kits Manufacturing Plants
  20. Ventilators Manufacturing Plants
  21. PCR Reagents Manufacturing Plants
  22. PCR Systems Manufacturing Plants
  23. Nose & Mouth Swabs Manufacturing Plants
  24. Medical Glass & Other Manufacturing Plants
  25. R&D Equipment & Consumables
  26. Medical Glass and Other Products & Services


  • By 6 Vertical Market:
  1. Hospitals and Surge Hospitals
  2. Clinical Labs
  3. Clinics
  4. Emergency Medical Services (EMS)
  5. Homecare & Nursing Homes
  6. Research Bodies


  • By 13 National Markets:
  1. U.S.A
  2. Canada
  3. UK
  4. Germany
  5. France
  6. Italy
  7. Rest of Europe
  1. India
  2. China
  3. South Korea
  4. Japan
  5. Rest of Asia Pacific
  6. RoW


  • By 5 Regional Markets:
  1. North America
  2. Latin America
  3. Europe
  4. Middle East & Africa
  5. Asia Pacific


  • By 4 Revenue Source Markets:
  1. Product Sales
  2. Training Services
  3. Planning & Consulting
  4. Maintenance & Upgrades


C. Detailed market analysis frameworks for each of the market sectors are provided, including:

  1. Market drivers & inhibitors
  2. Business opportunities
  3. SWOT analysis
  4. Competitive analysis for each of the 54 products and services that covers:
    1. Barriers to Entry
    2. Supplier Power
    3. Buyer Power
    4. Barriers to Substitution.
  5. Business environment
  6. The 2020-2024 market segmented into 212 submarkets


D. The report provides an updated extensive data of the leading 37 companies (including companies’ profile, recent annual revenues, COVID-19 mitigation activities & products and contact information).


E. The report includes over 2300 links to the COVID-19 Pandemic Mitigation community information sources


F. The report mentions > 450 Vendors including the following:

3M Company, 3Scan, Abbott , AbCellera, Advenio Technosys, Agfa Healthcare, Agilent Technologies, AiCure, Aindra, Allscripts Healthcare Solutions, Amara Health Analytics , Amazon , analyticsMD, Apixio, Apple, Arterys Inc, Atlas Wearables, Atomwise, Avalon Nutrition VITL, Babylon Health, Bay Labs, Behold.ai, benevolent.ai, BIOBEATS, BlueDot, Bollé Safety, Bullard, Buoy Health, Care Angel Wearables QorQL, Careskore, Clinithink, Cloud Pharmaceuticals, CloudMedx, CureMetrix Mental health Ginger.io, Cyrcadia, Deep 6 AI, Deep Genomics, Dell Technologies Inc., Delta Plus Group, Desktop Genetics Virtual mate Ada Health, DreaMed Diabetes, Dupont, EaglEyeMed, Eli Lilly, Encon Safety Products, Enlitic, EnsoData, Entopsis, Envisagenics Research iCarbonX, ERB Industries Inc., Ergodyne, Essilor of America, Flashback Technologies, Flow Health, Ford, Freenome, Frequency Therapeutics Inc., Fujifilm Holdings Corporation, Gateway Safety Inc., GE Healthcare, General Electric, General Motors, General Vision, Gentex Corporation, Gibco, Gilead Sciences, Globavir Biosciences, Google, Healint, Health Fidelity, HealthNextGen, HexArmor, Hindsait, Honeywell Safety Products, IBM, Imagen Technologies, Imagia Cybernetics, Infermedica, Infervision, Inovio Pharmaceuticals, Inside DNA, InSilico Medicine, Intel Corporation, Intendu, Invitrogen, Ion Torrent, Ironwear, Johnson & Johnson (Janssen), Jvion, Kapa Biosystems, Keen Eye Technologies, Kimberly-Clark Professional, Koninklijke Philips NV, Lexmark International Inc., LifeGraph, Lucina Health, Lumiata, Lunit, Lytics, Magnea, Maxim Biotech, Maxwell MRI, McKesson Corporation, MCR Safety, Medal, Medalogix, Medasense, MedAware, Medtronic, MedWhat, MedyMatch , Merck, Metabiota, Micron Technology, Microsoft Corporation, Mindshare Medical, Moderna, Morpheo, Niramai Health Analytix, Novarad Corporation, NuMedii, Numerate, Nuritas Pharma Turbine, Nvidia Corporation, Oncora Medical, Ovuline, PeerWell, Pfizer, Philips, Philips Healthcare, PhysIQ., Precision Health Intelligence, Predible Health, Profility, Proscia, pulseData, Pyramex Safety, Qualaris Healthcare Solutions, Qualcomm Incorporated, Qualcomm Incorporated, Qure. Ai, Radians Inc., Recursion Pharmaceuticals, Regeneron Pharmaceuticals, Roam Analytics   , Roche, RxPREDICT, Safety Optical Service, Samsung Electronics Co., Ltd, Sanofi, Saykara, Sellstrom Manufacturing Company (SureWerx), Sense.ly, Sensory Inc., Siemens, Sigma-Aldrich Corp., Skymind Inc., Thermo Fisher Scientific, Toshiba, Vir Biotechnology Inc., VisionAid Inc., WuXi Biologics, Xilinx Inc..


G. COVID-19 Pandemic Mitigation Products & Services Market report includes 24 appendices:

  1. Appendix 1: Differences & Similarities Between Common Flu and Coronavirus
  2. Appendix 2: Coronavirus Personal Protective Equipment (PPE) for Healthcare Personnel
  3. Appendix 3: CDC Strategies for Optimizing the Supply of Eye Protection
  4. Appendix 4: CDC Strategies for Optimizing the Supply of Isolation Gowns
  5. Appendix 5: CDC Strategy for Optimizing the Supply of Facemasks
  6. Appendix 6:  CDC Strategies for Optimizing the Supply of N95 Respirators
  7. Appendix 7: CDC Adult Vaccine Price List
  8. Appendix 8: The CDC COVID-19 Bio-Safety Guidelines
  9. Appendix 9: The 2020 Global Desperation to Protect Medical Workers
  10. Appendix 10: Disinfection Procedures for COVID-19
  11. Appendix 11: Breakdown of the COVID-19 USA Medical Services Stimulus April 2020
  12. Appendix 12: European Preparedness Against Emerging Epidemics
  13. Appendix 13: Development and Regulation by the CDC and FDA Diagnostic Testing for COVID-19
  14. Appendix 14: The U.S. Defense Production Act: Example FEMA COVID-19 Supply Chain Stabilization
  15. Appendix 15:  The Global Research Collaboration for Infectious Disease Preparedness (GLOPID-R)
  16. Appendix 16: Comparing Clinical COVID-19 Data by Nation
  17. Appendix 17: Home Healthcare IT
  18. Appendix 18: The Difference between PCR and Antibody Tests
  19. Appendix 19: COVID-19 Pandemic Global Economic Effects- 2020-2021
  20. Appendix 20: COVID-19 Tests
  21. Appendix 21: Rapid Communication on the Role of the GeneXpert® Platform for Rapid Molecular Testing for SARS-CoV-2 in the WHO European Region
  22. Appendix 22: Abbreviations
  23. Appendix 23: Glossary
  24. Appendix 24: Bibliography

Table of Contents

Download TOC as PDF

5 Volumes:

COVID-19 Pandemic Mitigation Products Market – 2020-2024: Volume 1

COVID-19 Pandemic Mitigation Products Market – 2020-2024: Volume 2

COVID-19 Pandemic Mitigation products Market – 2020-2024: Volume 3

COVID-19 Pandemic Mitigation Products Market – 2020-2024: Volume 4

COVID-19 Pandemic Mitigation Products Market – 2020-2024: Volume 5


COVID-19 Pandemic Mitigation Products Market – 2020-2024: Volume 1

Download the PDF

1         Market Definition………………………………….. 9

1.1        Introduction…………………………………….. 9

1.2        Scenario A: Assumptions………………….. 9

1.3        Scenario B: Assumptions………………….. 9

2         Executive Summary…………………………….. 11

2.1        Key Findings…………………………………. 11

2.2        COVID-19 Mitigation Funding  (January – May 2020)……………………………………. 27

2.3        Key Conclusions……………………………. 30

2.4        COVID-19 Pandemic Mitigation Products Market Research Vectors………………… 45

2.5        COVID-19 Pandemic Mitigation R&D Challenges……………………………………. 45

2.6        Global COVID-19 Pandemic Mitigation Market – 2020-2024………………………… 46

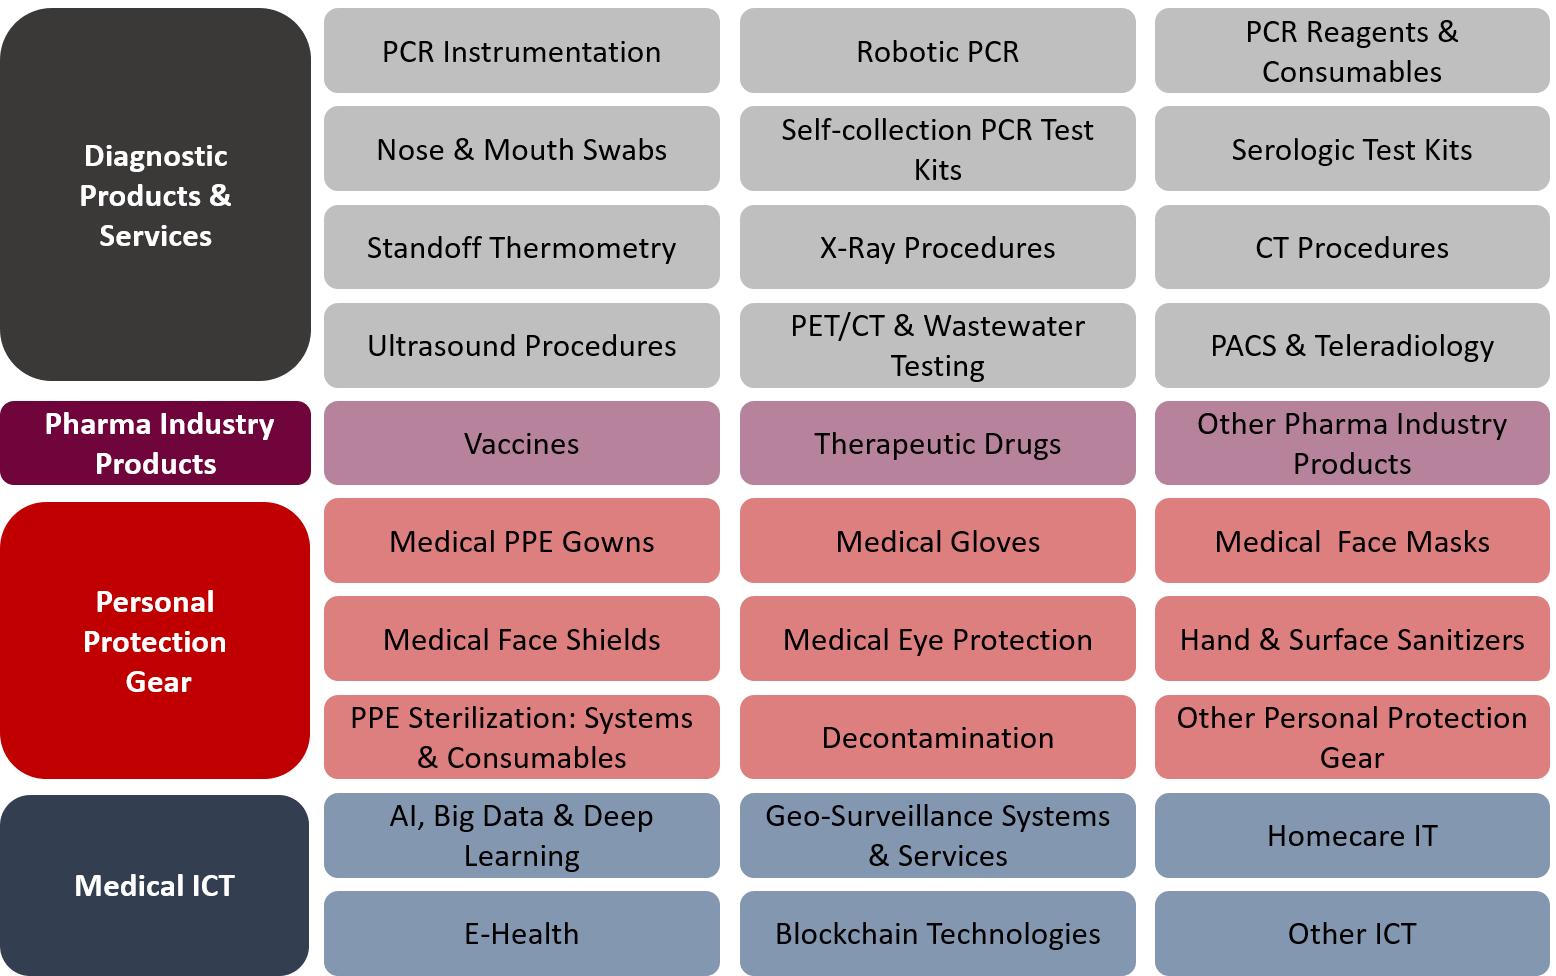
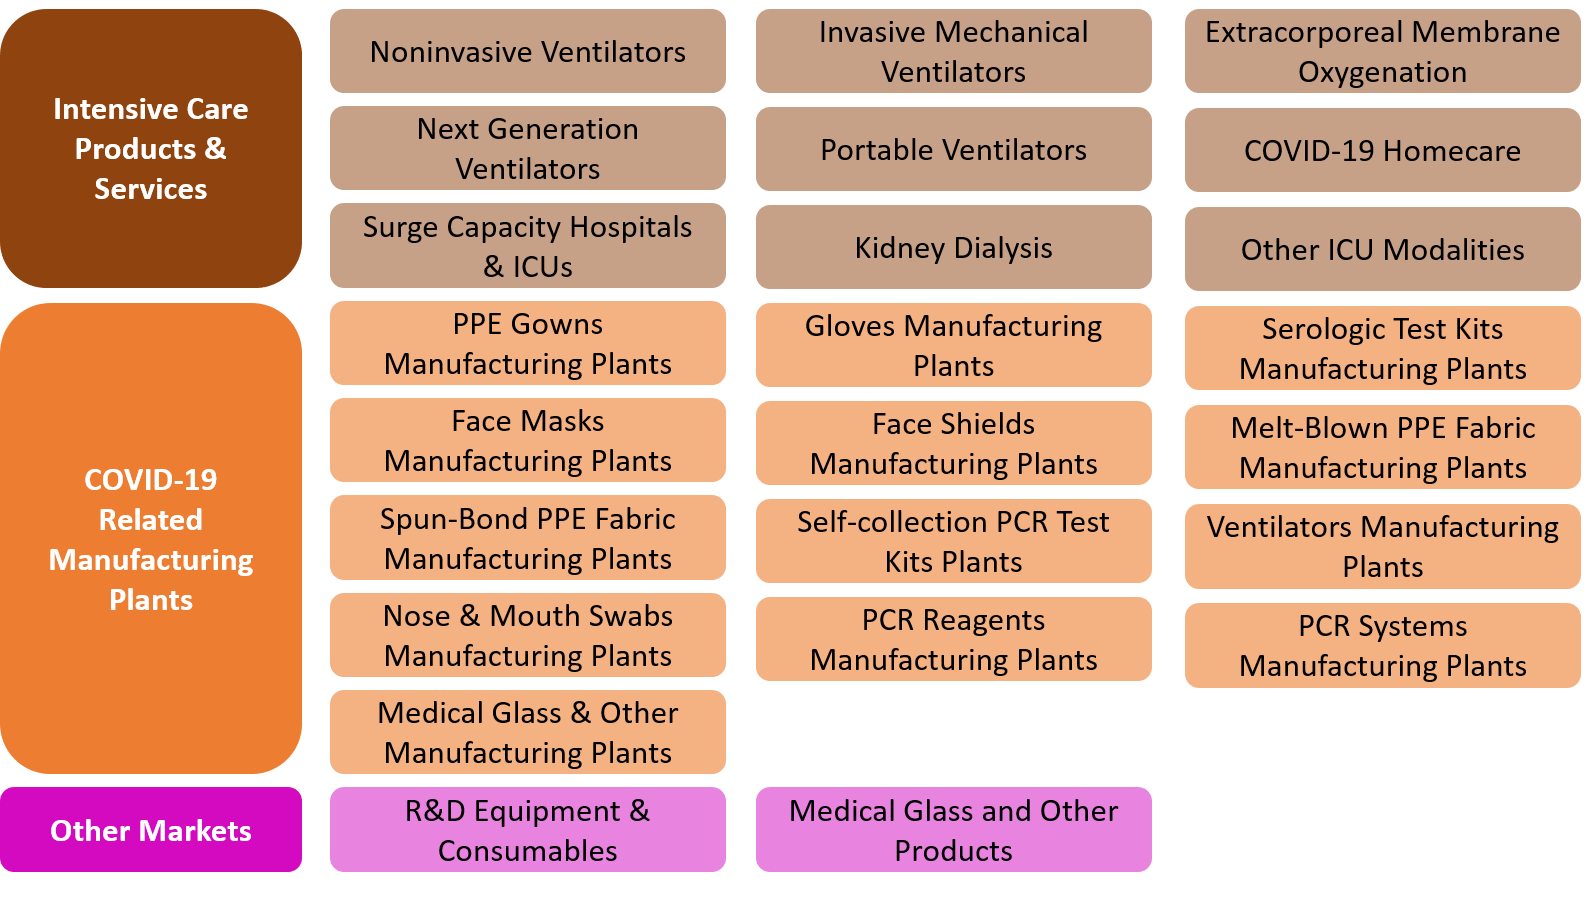
2.6.1            Products & Services Groups Markets……………………………………………… 46

2.6.2            Products & Services Markets……… 50

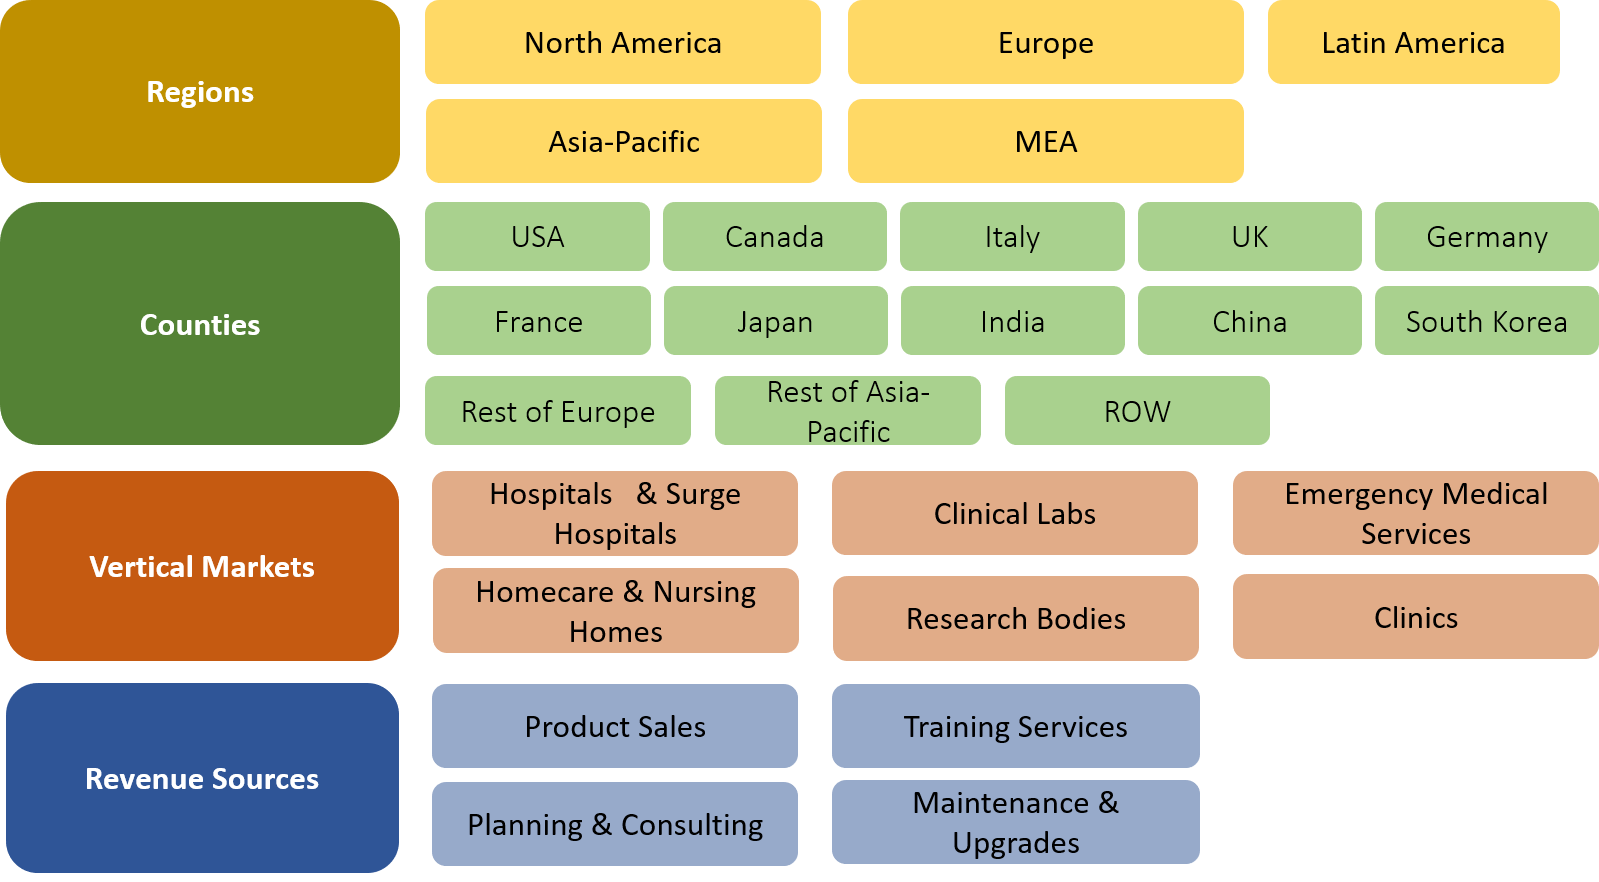
2.6.3            Vertical Markets……………………….. 54

2.6.4            Revenue Source Markets…………… 55

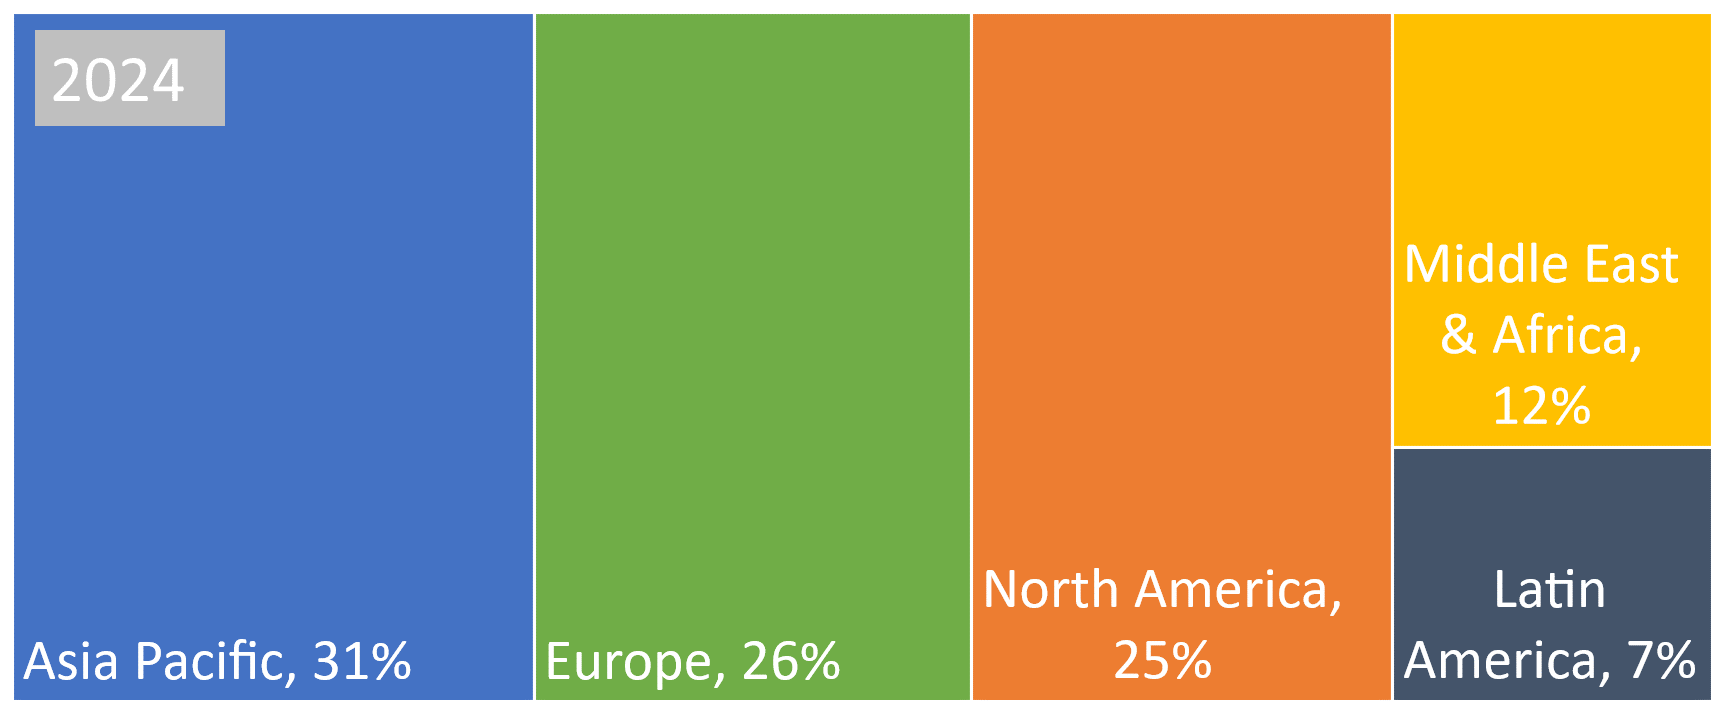
2.6.5            Regional Markets……………………… 55

2.6.6            National Markets………………………. 56

3         The SARS‑CoV‑2 2019 Pandemic………….. 58

3.1        COVID-19 Basics…………………………… 58

3.2        COVID-19 Infection Rate…………………. 61

3.3        Social Distancing……………………………. 62

3.4        The Effect of Quarantine…………………. 64

3.5        Comparison of SARS-CoV-2 and Common Cold and Flu Viruses………….. 65

3.6        The SARS-CoV-2 Genome Information 66

3.7        Active Infection Testing…………………… 67

3.7.1            Nucleic Acid Detection………………. 67

3.7.2            Antigen Detection…………………….. 69

3.7.3            Other Technologies…………………… 69

3.8        Serology Testing……………………………. 70

4         Market Drivers…………………………………….. 73

5         Market Inhibitors…………………………………. 74

6         COVID-19 Pandemic Mitigation Products Market SWOT Analysis………………………… 75

6.1        Strengths……………………………………… 75

6.2        Weaknesses…………………………………. 76

6.3        Opportunities………………………………… 77

6.4        Threats………………………………………… 79

7         Business Opportunities & Challenges…… 81

8         COVID-19 Pandemic Mitigation Industry… 83

8.1        The COVID-19 Pandemic Mitigation Products Value Chain…………………….. 83

8.2        COVID-19 Pandemic Mitigation Products Industry Primary Activities……………….. 84

8.3        COVID-19 Pandemic Mitigation Products industry Support Activities……………….. 84

9         COVID-19 Pandemic Mitigation Products Industry: Barriers to Entry, Supplier Power, Buyer Power & Barriers to Substitution…. 86


GLOBAL MARKET……………………………………… 87

10      Global COVID-19 Pandemic Mitigation Market – 2020-2024………………………………. 87

10.1     Global COVID-19 Pandemic Mitigation Products & Services Groups Markets – 2020-2024……………………………………. 87

10.1.1         Global COVID-19 Pandemic Mitigation Products & Services Groups Markets: Scenario A………. 87

10.1.1.1      Market Size…………………………… 87

10.1.1.2      Market Dynamics…………………… 89

10.1.1.3      Market Share………………………… 89

10.1.2         Global COVID-19 Pandemic Mitigation Products & Services Groups Markets: Scenario B………. 90

10.1.2.1      Market Size…………………………… 90

10.1.2.2      Market Dynamics…………………… 91

10.1.2.3      Market Share………………………… 92

10.1.3         Global COVID-19 Pandemic Mitigation Market: Scenarios Comparison…………………………….. 92

10.2     Global COVID-19 Pandemic Mitigation Products & Services Markets – 2020-2024…………………………………………………… 93

10.2.1         Global COVID-19 Pandemic Mitigation Products & Services Markets: Scenario A………………….. 94

10.2.1.1      Market Size…………………………… 94

10.2.1.2      Market Dynamics…………………… 96

10.2.2         Global COVID-19 Pandemic Mitigation Products & Services Markets: Scenario B………………….. 98

10.2.2.1      Market Size…………………………… 98

10.2.2.2      Market Dynamics………………….. 101

10.2.3         Global COVID-19 Pandemic Mitigation Products & Services Groups Markets: Scenarios Comparison…………………………… 103

10.3     Global Vertical COVID-19 Pandemic Mitigation Markets – 2020-2024………. 104

10.3.1         Global COVID-19 Pandemic Mitigation Vertical Markets: Scenario A…………………………………………. 104

10.3.1.1      Market Size…………………………. 104

10.3.1.2      Market Dynamics………………….. 105

10.3.1.3      Market Share……………………….. 105

10.3.2         Global COVID-19 Pandemic Mitigation Vertical Markets: Scenario B…………………………………………. 106

10.3.2.1      Market Size…………………………. 106

10.3.2.2      Market Dynamics………………….. 106

10.3.2.3      Market Share……………………….. 107

10.3.3         Global COVID-19 Pandemic Mitigation Vertical Markets: Scenarios Comparison…………………………… 107

10.4     Global COVID-19 Pandemic Mitigation Products & Services Market by Revenue Source – 2020-2024……………………… 108

10.4.1         Global COVID-19 Pandemic Mitigation Products & Services Market: Scenario A………………….. 108

10.4.2         Global COVID-19 Pandemic Mitigation Products & Services Market: Scenario B………………….. 109

10.4.3         Global COVID-19 Pandemic Mitigation Revenue Sources: Scenarios Comparison…………….. 111

10.5     Regional COVID-19 Pandemic Mitigation Markets – 2020-2024……………………. 112

10.5.1         Regional COVID-19 Pandemic Mitigation Market: Scenario A……. 112

10.5.1.1      Market Size…………………………. 112

10.5.1.2      Market Dynamics………………….. 112

10.5.1.3      Market Share……………………….. 113

10.5.2         Regional COVID-19 Pandemic Mitigation Market: Scenario B……. 113

10.5.2.1      Market Size…………………………. 113

10.5.2.2      Market Dynamics………………….. 114

10.5.2.3      Market Share……………………….. 114

10.5.3         Regional COVID-19 Pandemic Mitigation Market: Scenarios Comparison…………………………… 115

10.6     National COVID-19 Pandemic Mitigation Markets – 2020-2024……………………. 116

10.6.1         National COVID-19 Pandemic Mitigation Market: Scenario A……. 116

10.6.1.1      Market Size…………………………. 116

10.6.1.2      Market Dynamics………………….. 118

10.6.1.3      Market Shares……………………… 118

10.6.2         National COVID-19 Pandemic Mitigation Market: Scenario B……. 119

10.6.2.1      Market Size…………………………. 119

10.6.2.2      Market Dynamics………………….. 121

10.6.2.3      Market Share……………………….. 122

10.6.3         COVID-19 National Markets: Scenarios Comparison…………….. 122


[Back to top]

COVID-19 Pandemic Mitigation Products Market – 2020-2024: Volume 2

Download the PDF

PRODUCT/SERVICE MARKETS……………………. 32

1         COVID-19 Vaccines Market – 2020-2024… 32

1.1        COVID-19 Vaccines Market Background…………………………………………………… 32

1.1.1            Introduction……………………………… 32

1.1.2            Global COVID-19 Vaccine Development Funding……………….. 38

1.1.3            Vaccines Prices……………………….. 48

1.1.4            COVID-19 Vaccines Market: Conclusions…………………………….. 50

1.1.5            COVID-19 Vaccines:Business Opportunities…………………………… 53

1.1.6            COVID-19 Vaccines: Competitive Analysis: : Barriers to Entry, Supplier Power, Buyer Power and Substitution……………………………………………… 54

1.1.7            Present and Potential Vendors……. 55

1.2        Global COVID-19 Pandemic Mitigation: Vaccines Market – 2020-2024………….. 58

1.2.1            Vaccines COVID-19 Pandemic Mitigation Market – 2020-2024: Scenario A………………………………. 58

1.2.2            Vaccines COVID-19 Pandemic Mitigation Market – 2020-2024: Scenario B………………………………. 59

2         COVID-19 Post-Infection Therapeutic Drugs Market – 2020-2024……………………………… 60

2.1        COVID-19 Post-Infection Therapies Drugs Market Background………………………… 60

2.1.1            Introduction……………………………… 60

2.1.2            Computer Aided COVID-19 Drug Research………………………………… 66

2.1.3            Adaptive Designs For COVID‑19 Clinical Trials…………………………… 67

2.1.4            COVID-19 Therapeutic Drugs  Market: Conclusions…………………. 67

2.1.5            COVID-19 Therapeutic Drug :Business Opportunities…………….. 69

2.1.6            COVID-19 Post-Infection Therapeutic Drug: Competitive Analysis: Barriers to Entry, Supplier Power, Buyer Power and Substitution……………… 70

2.1.7            Present and Potential Vendors……. 71

2.2        Global COVID-19 Post-Infection Therapeutic Drugs Market – 2020-2024 74

2.2.1            COVID-19 Post Infection Therapeutic Drugs Market – 2020-2024: Scenario A…………………………………………… 74

2.2.2            Therapeutic Drugs COVID-19 Pandemic Mitigation Market – 2020-2024: Scenario B……………………… 75

3         Other Pharma Industry Products COVID-19 Pandemic Mitigation Market – 2020-2024.. 76

3.1        Other COVID-19 Pharma Industry Products Market Background…………… 76

3.1.1            Introduction and Findings…………… 76

3.1.2            Other COVID-19 Pharma Industry Products  Market: Conclusions……. 78

3.1.3            Other COVID-19 Pharma Industry Products: Competitive Analysis: Barriers to Entry, Supplier Power, Buyer Power and Substitution…….. 79

3.2        Global COVID-19 Pandemic Mitigation: Other Pharma Industry Products Market – 2020-2024……………………………………. 80

3.2.1            Other Pharma Industry Products COVID-19 Pandemic Mitigation Market – 2020-2024: Scenario A…. 80

3.2.2            Other Pharma Industry Products COVID-19 Pandemic Mitigation Market – 2020-2024: Scenario B…. 80

4         PCR Instrumentation & Software COVID-19 Pandemic Mitigation Market – 2020-2024.. 82

4.1        COVID-19 PCR Instrumentation & Software Market Background…………… 82

4.1.1            Introduction……………………………… 82

4.1.2            PCR Technologies & Procedures… 84

4.1.3            PCR Advantages……………………… 88

4.1.4            PCR Limitations……………………….. 88

4.1.5            PCR Based Coronavirus Diagnostics Used and Developed During January – April  2020……………………………. 90

4.1.6            Efforts to Develop and Disseminate a Test for COVID-19……………………. 91

4.1.7            PCR Purchasing Considerations…. 92

4.1.8            Costs of PCR Testing………………… 93

4.1.9            PCR Instrumentation & Software  Market: Conclusions…………………. 93

4.1.10         PCR Instrumentation & Software: Business Opportunities……………… 94

4.1.11         PCR Instrumentation & Software: Competitive Analysis: Barriers to Entry, Supplier Power, Buyer Power and Substitution……………………….. 95

4.1.12         Key Vendors……………………………. 96

4.2        Global COVID-19 Pandemic Mitigation: PCR Instrumentation & Software Market – 2020-2024……………………………………. 96

4.2.1            PCR Instrumentation & Software COVID-19 Pandemic Mitigation Market – 2020-2024: Scenario A…. 97

4.2.2            PCR Instrumentation & Software COVID-19 Pandemic Mitigation Market – 2020-2024: Scenario B…. 97

5         Robotic PCR Systems & Software COVID-19 Pandemic Mitigation Market – 2020-2024.. 98

5.1        COVID-19 Robotic PCR Systems & Software Market Background…………… 98

5.1.1            Introduction and Findings…………… 98

5.1.2            Pooling  PCR Method  Testing Over 60 Samples Simultaneously……… 102

5.1.3            Robotic PCR Systems & Software  Market: Conclusions………………… 102

5.1.4            Robotic PCR Systems & Software: Business Opportunities……………. 103

5.1.5            Robotic PCR Systems & Software: Competitive Analysis: Barriers to Entry, Supplier Power, Buyer Power and Substitution……………………… 104

5.2        Global COVID-19 Pandemic Mitigation: Robotic PCR Systems & Software Market – 2020-2024………………………………… 105

5.2.1            Robotic PCR Systems & Software COVID-19 Pandemic Mitigation Market – 2020-2024: Scenario A.. 105

5.2.2            Robotic PCR Systems & Software COVID-19 Pandemic Mitigation Market – 2020-2024: Scenario B.. 106

6         PCR Reagents & Consumables COVID-19 Pandemic Mitigation Market – 2020-2024 107

6.1        COVID-19 PCR Reagents & Consumables Market Background…… 107

6.1.1            Introduction……………………………. 107

6.1.2            PCR Reagents & Consumables  Market: Conclusions………………… 108

6.1.3            PCR Reagents & Consumables: Business Opportunities……………. 109

6.1.4            PCR Reagents & Consumables: Competitive Analysis: Barriers to Entry, Supplier Power, Buyer Power and Substitution……………………… 110

6.2        1.2 Global COVID-19 Pandemic Mitigation: PCR Reagents & Consumables Market – 2020-2024….. 111

6.2.1            PCR Reagents & Consumables COVID-19 Pandemic Mitigation Market – 2020-2024: Scenario A.. 111

6.2.2            PCR Reagents & Consumables COVID-19 Pandemic Mitigation Market – 2020-2024: Scenario B.. 112

7         Nose & Mouth Swabs COVID-19 Pandemic Mitigation Market – 2020-2024…………….. 113

7.1        COVID-19 Nose & Mouth Swabs Market Background…………………………………. 113

7.1.1            Introduction and Findings…………. 113

7.1.2            Nose & Mouth Swabs: Competitive Analysis: Barriers to Entry, Supplier Power, Buyer Power and Substitution……………………………………………. 116

7.2        Global COVID-19 Pandemic Mitigation: Nose & Mouth Swabs Market – 2020-2024………………………………………….. 117

7.2.1            Nose & Mouth Swabs COVID-19 Pandemic Mitigation Market – 2020-2024: Scenario A……………………. 117

7.2.2            Nose & Mouth Swabs COVID-19 Pandemic Mitigation Market – 2020-2024: Scenario B……………………. 117

8         Self-collection PCR Test Kits COVID-19 Pandemic Mitigation Market – 2020-2024 119

8.1        COVID-19 Self-collection PCR Test Kits Market Background………………………. 119

8.1.1            Saliva Tests…………………………… 120

8.2        COVID-19 Pandemic Mitigation: Self-collection PCR Test Kits Market – 2020-2024………………………………………….. 122

8.2.1            Self-collection PCR Test Kits COVID-19 Pandemic Mitigation Market – 2020-2024: Scenario A…………….. 123

8.2.2            Self-collection PCR Test Kits COVID-19 Pandemic Mitigation Market – 2020-2024: Scenario B…………….. 123

9         Serologic Test Kits COVID-19 Pandemic Mitigation Market – 2020-2024…………….. 124

9.1        COVID-19 Serologic Test Kits Market Background…………………………………. 124

9.1.1            Introduction and Findings…………. 124

9.1.2            FDA Statement Related to the Status of Serological (Antibody) Tests….. 130

9.1.3            Coronavirus Antibody Test Kits….. 131

9.1.4            Serologic Test Kits  Market: Conclusions…………………………… 135

9.1.5            Serologic Test Kits: Business Opportunities…………………………. 137

9.1.6            Serologic Test Kits: Competitive Analysis: Barriers to Entry, Supplier Power, Buyer Power and Substitution……………………………………………. 138

9.1.7            Key Vendors………………………….. 139

9.2        Global COVID-19 Pandemic Mitigation: Serologic Test Kits Market – 2020-2024…………………………………………………. 139

9.2.1            Serologic Test Kits COVID-19 Pandemic Mitigation Market – 2020-2024: Scenario A……………………. 139

9.2.2            Serologic Test Kits COVID-19 Pandemic Mitigation Market – 2020-2024: Scenario B……………………. 140

10      Standoff Thermometry COVID-19 Pandemic Mitigation Market – 2020-2024…………….. 141

10.1     COVID-19 Standoff Thermometry Market Background…………………………………. 141

10.1.1         Introduction and Findings…………. 141

10.1.2         Standoff Thermometry  Market: Conclusions…………………………… 144

10.1.3         Standoff Thermometry: Business Opportunities…………………………. 145

10.1.4         Key Vendors………………………….. 145

10.2     Global COVID-19 Pandemic Mitigation: Standoff Thermometry Market – 2020-2024………………………………………….. 145

10.2.1         Standoff Thermometry COVID-19 Pandemic Mitigation Market – 2020-2024: Scenario A……………………. 146

10.2.2         Standoff Thermometry COVID-19 Pandemic Mitigation Market – 2020-2024: Scenario B……………………. 146

11      X-Ray Procedures COVID-19 Pandemic Mitigation Market – 2020-2024…………….. 147

11.1     COVID-19 X-Ray Procedures Market Background…………………………………. 147

11.1.1         Introduction and Findings…………. 147

11.1.2         X-Ray Procedures  Market: Conclusions…………………………… 152

11.1.3         Key Vendors………………………….. 153

11.2     Global COVID-19 Pandemic Mitigation: X-Ray Procedures Market – 2020-2024. 153

11.2.1         X-Ray Procedures COVID-19 Pandemic Mitigation Market – 2020-2024: Scenario A……………………. 154

11.2.2         X-Ray Procedures COVID-19 Pandemic Mitigation Market – 2020-2024: Scenario B……………………. 154

12      CT Procedures COVID-19 Pandemic Mitigation Market – 2020-2024…………….. 155

12.1     COVID-19 CT Procedures Market Background…………………………………. 155

12.1.1         Introduction and Findings…………. 155

12.1.2         CT Procedures  Market: Conclusions……………………………………………. 158

12.1.3         CT Procedures: Business Opportunities…………………………. 159

12.1.4         Key Vendors………………………….. 159

12.2     Global COVID-19 Pandemic Mitigation: CT Procedures Market – 2020-2024… 159

12.2.1         CT Procedures COVID-19 Pandemic Mitigation Market – 2020-2024: Scenario A…………………………….. 160

12.2.2         CT Procedures COVID-19 Pandemic Mitigation Market – 2020-2024: Scenario B…………………………….. 160

13      Ultrasound Procedures COVID-19 Pandemic Mitigation Market – 2020-2024…………….. 162

13.1     COVID-19 Ultrasound Procedures Market Background…………………………………. 162

13.1.1         Introduction and Findings…………. 162

13.1.2         FDA Approved “ EMT & Field” Smartphone-Tablet Based  Coronavirus Chest Ultrasound…… 164

13.1.3         COVID-19 Chest Ultrasound Diagnostics……………………………. 164

13.1.4         Ultrasound Procedures Market: Conclusions…………………………… 165

13.1.5         Ultrasound Procedures: Business Opportunities…………………………. 166

13.1.6         Key Vendors………………………….. 166

13.2     Global COVID-19 Pandemic Mitigation: Ultrasound Procedures Market – 2020-2024………………………………………….. 167

13.2.1         Ultrasound Procedures COVID-19 Pandemic Mitigation Market – 2020-2024: Scenario A……………………. 167

13.2.2         Ultrasound Procedures COVID-19 Pandemic Mitigation Market – 2020-2024: Scenario B……………………. 167

14      FDG-PET/CT Procedures & Wastewater Testing COVID-19 Pandemic Mitigation Market – 2020-2024……………………………. 169

14.1     COVID-19 FDG-PET/CT Procedures & Wastewater Testing Market Background…………………………………………………. 169

14.1.1         Introduction and Findings…………. 169

14.1.2         FDG-PET/CT Procedures…………. 170

14.1.3         COVID-19 Wastewater Testing….. 171

14.1.4         FDG-PET/CT Procedures & Wastewater Testing Market: Conclusions…………………………… 173

14.1.5         FDG-PET/CT Procedures & Wastewater Testing: Business Opportunities…………………………. 173

14.1.6         Key Vendors………………………….. 173

14.2     Global COVID-19 Pandemic Mitigation: FDG-PET/CT Procedures & Wastewater Testing Market – 2020-2024…………… 173

14.2.1         FDG-PET/CT Procedures & Wastewater Testing COVID-19 Pandemic Mitigation Market – 2020-2024: Scenario A……………………. 174

14.2.2         FDG-PET/CT Procedures & Wastewater Testing COVID-19 Pandemic Mitigation Market – 2020-2024: Scenario B……………………. 174

15      PACS & Teleradiology COVID-19 Pandemic Mitigation Market – 2020-2024…………….. 176

15.1     PACS & Teleradiology Market Background…………………………………. 176

15.1.1         Introduction and Findings…………. 176

15.1.2         The FDA PACS & Teleradiography  COVID-19 Pandemic Policy………. 180

15.1.3         PACS & Teleradiology Market: Conclusions…………………………… 181

15.1.4         PACS & Teleradiology: Business Opportunities…………………………. 181

15.1.5         Key Vendors………………………….. 182

15.2     Global COVID-19 Pandemic Mitigation: PACS & TeleradiologyMarket – 2020-2024………………………………………….. 182

15.2.1         PACS & TeleradiologyCOVID-19 Pandemic Mitigation Market – 2020-2024: Scenario A……………………. 183

15.2.2         PACS & TeleradiologyCOVID-19 Pandemic Mitigation Market – 2020-2024: Scenario B……………………. 183

16      PPE Gowns COVID-19 Pandemic Mitigation Market – 2020-2024……………………………. 184

16.1     Pandemic PPE Gowns Market Background…………………………………. 184

16.1.1         Introduction and Findings…………. 184

16.1.2         PPE Gowns  Market: Conclusions 190

16.1.3         PPE Gowns: Business Opportunities……………………………………………. 190

16.2     Global COVID-19 Pandemic Mitigation: PPE Gowns Market – 2020-2024…….. 191

16.2.1         PPE Gowns COVID-19 Pandemic Mitigation Market – 2020-2024: Scenario A…………………………….. 191

16.2.2         PPE Gowns COVID-19 Pandemic Mitigation Market – 2020-2024: Scenario B…………………………….. 192

17      Gloves COVID-19 Pandemic Mitigation Market – 2020-2024……………………………. 193

17.1     COVID-19 Gloves Market Background 193

17.1.1         Introduction and Findings…………. 193

17.1.2         Gloves  Market: Conclusions…….. 194

17.1.3         Gloves: Business Opportunities…. 194

17.2     Global COVID-19 Pandemic Mitigation: Gloves Market – 2020-2024…………… 195

17.2.1         Gloves COVID-19 Pandemic Mitigation Market – 2020-2024: Scenario A…………………………….. 195

17.2.2         Gloves COVID-19 Pandemic Mitigation Market – 2020-2024: Scenario B…………………………….. 196

18      Face Masks COVID-19 Pandemic Mitigation Market – 2020-2024……………………………. 197

18.1     Medical  Face Masks Market Background…………………………………………………. 197

18.1.1         Introduction and Findings…………. 197

18.1.2         N95 Masks Vs. Surgical Mask…… 198

18.1.3         Face Masks Precautions………….. 203

18.1.4         Face Masks  Market: Conclusions 204

18.1.5         Face Masks: Business Opportunities……………………………………………. 204

18.1.6         Key Vendors………………………….. 204

18.2     Global COVID-19 Pandemic Mitigation: Face Masks Market – 2020-2024…….. 205

18.2.1         Face Masks COVID-19 Pandemic Mitigation Market – 2020-2024: Scenario A…………………………….. 206

18.2.2         Face Masks COVID-19 Pandemic Mitigation Market – 2020-2024: Scenario B…………………………….. 206

19      Medical Face Shields COVID-19 Pandemic Mitigation Market – 2020-2024…………….. 207

19.1     Medical Face Shields Market Background…………………………………………………. 207

19.1.1         Introduction and Findings…………. 207

19.1.2         Face Shields Standards…………… 209

19.2     Global COVID-19 Pandemic Mitigation: Medical Face Shields Market – 2020-2024…………………………………………………. 210

19.2.1         Medical Face Shields COVID-19 Pandemic Mitigation Market – 2020-2024: Scenario A……………………. 210

19.2.2         Medical Face Shields COVID-19 Pandemic Mitigation Market – 2020-2024: Scenario B……………………. 211

20      Eye Protection COVID-19 Pandemic Mitigation Market – 2020-2024…………….. 212

20.1     Pandemic Eye Protection Market Background…………………………………. 212

20.1.1         Introduction and Findings…………. 212

20.1.2         Key Vendors………………………….. 213

20.2     Global COVID-19 Pandemic Mitigation: Eye Protection Market – 2020-2024…. 214

20.2.1         Eye Protection COVID-19 Pandemic Mitigation Market – 2020-2024: Scenario A…………………………….. 214

20.2.2         Eye Protection COVID-19 Pandemic Mitigation Market – 2020-2024: Scenario B…………………………….. 215

21      PPE Sterilization: Systems & Consumables COVID-19 Pandemic Mitigation Market – 2020-2024…………………………………………. 216

21.1     Global COVID-19 Pandemic Mitigation: PPE Sterilization: Systems & Consumables Market – 2020-2024….. 216

21.1.1         PPE Sterilization: Systems & Consumables COVID-19 Pandemic Mitigation Market – 2020-2024: Scenario A…………………………….. 216

21.1.2         PPE Sterilization: Systems & Consumables COVID-19 Pandemic Mitigation Market – 2020-2024: Scenario B…………………………….. 217

22      Hand & Surface Sanitizers COVID-19 Pandemic Mitigation Market – 2020-2024 218

22.1     Hand & Surface Sanitizers Market Background…………………………………. 218

22.2     Global COVID-19 Pandemic Mitigation: Hand & Surface Sanitizers Market – 2020-2024………………………………………….. 221

22.2.1         Hand & Surface Sanitizers COVID-19 Pandemic Mitigation Market – 2020-2024: Scenario A……………………. 221

22.2.2         Hand & Surface Sanitizers COVID-19 Pandemic Mitigation Market – 2020-2024: Scenario B……………………. 222

23      Decontamination COVID-19 Pandemic Mitigation Market – 2020-2024…………….. 223

23.1     Decontamination Market Background. 223

23.1.1         Introduction……………………………. 223

23.1.2         Definitions……………………………… 224

23.1.3         Timing and Location Of Cleaning And Disinfection Of Surfaces…………… 224

23.1.4         Hard (Non-porous) Surfaces……… 225

23.1.5         Soft (Porous) Surfaces…………….. 225

23.1.6         Electronics…………………………….. 225

23.1.7         Linens, Clothing, and Other Items That Go in the Laundry…………….. 226

23.1.8         Risk of Exposure…………………….. 226

23.1.9         Considerations for Employers……. 227

23.1.10       Decontamination  Market: Conclusions…………………………… 227

23.2     Global COVID-19 Pandemic Mitigation: Decontamination Market – 2020-2024 228

23.2.1         Decontamination COVID-19 Pandemic Mitigation Market – 2020-2024: Scenario A……………………. 229

23.2.2         Decontamination COVID-19 Pandemic Mitigation Market – 2020-2024: Scenario B……………………. 229

24      Other Personal Protection Gear COVID-19 Pandemic Mitigation Market – 2020-2024 231

24.1     Global COVID-19 Pandemic Mitigation: Other Personal Protection Gear Market – 2020-2024………………………………….. 231

24.1.1         Other Personal Protection Gear COVID-19 Pandemic Mitigation Market – 2020-2024: Scenario A.. 231

24.1.2         Other Personal Protection Gear COVID-19 Pandemic Mitigation Market – 2020-2024: Scenario B.. 232

25      AI, Big Data & Deep Learning COVID-19 Pandemic Mitigation Market – 2020-2024 233

25.1     Pandemic AI, Big Data & Deep Learning Market Background………………………. 233

25.1.1         Introduction and Findings…………. 233

25.1.2         AI Based Early Warnings and Alerts……………………………………………. 235

25.1.3         Tracking and Prediction……………. 235

25.1.4         Data Dashboards……………………. 237

25.1.5         Diagnosis and Prognosis………….. 237

25.1.6         COVID-19 Treatments Optimization……………………………………………. 238

25.1.7         COVID-19 Pandemic Social Control……………………………………………. 239

25.1.8         Pandemic Outbreak Forecasting.. 240

25.1.9         AI, Big-Data and Deep Learning Assisted CT Imaging……………….. 242

25.1.10       AI, Big-Data and Deep-Learning Assisted COVID-19 Treatment….. 243

25.1.11       COVID-19: AI Assisted  X-rays Imaging………………………………… 244

25.1.12       COVID-19 AI, Big Data & Deep Learning……………………………….. 244

25.1.13       AI Assisted  Pandemic Symptoms Analysis………………………………… 246

25.1.14       AI, Big Data & Deep Learning Market: Conclusions…………………………… 247

25.1.15       AI, Big Data & Deep Learning: Business Opportunities……………. 248

25.1.16       Key Vendors………………………….. 248

25.2     Global COVID-19 Pandemic Mitigation: AI, Big Data & Deep Learning Market – 2020-2024………………………………….. 250

25.2.1         AI, Big Data & Deep Learning COVID-19 Pandemic Mitigation Market – 2020-2024: Scenario A…………….. 250

25.2.2         AI, Big Data & Deep Learning COVID-19 Pandemic Mitigation Market – 2020-2024: Scenario B…………….. 250

26      Homecare IT COVID-19 Pandemic Mitigation Market – 2020-2024……………………………. 252

26.1     Pandemic Homecare IT Market Background…………………………………. 252

26.1.1         Introduction and Findings…………. 252

26.1.2         Homecare IT  Market: Conclusions……………………………………………. 253

26.1.3         Homecare IT: Business Opportunities……………………………………………. 254

26.1.4         Key Vendors………………………….. 254

26.2     Global COVID-19 Pandemic Mitigation: Homecare IT Market – 2020-2024…… 255

26.2.1         Homecare IT COVID-19 Pandemic Mitigation Market – 2020-2024: Scenario A…………………………….. 255

26.2.2         Homecare IT COVID-19 Pandemic Mitigation Market – 2020-2024: Scenario B…………………………….. 255

27      Geo-Surveillance Systems & Services COVID-19 Pandemic Mitigation Market – 2020-2024…………………………………………. 257

27.1     Pandemic Geo-Surveillance Systems & Services Market Background………….. 257

27.1.1         Introduction and Findings…………. 257

27.1.2         MIT “Private Kit”……………………… 263

27.1.3         The UK NHS COVID-19 App…….. 265

27.1.4         Companies Making Cell Location Tracking Technology……………….. 266

27.2     Global COVID-19 Pandemic Mitigation: Geo-Surveillance Systems & Services Market – 2020-2024……………………… 270

27.2.1         Geo-Surveillance Systems & Services COVID-19 Pandemic Mitigation Market – 2020-2024: Scenario A.. 271

27.2.2         Geo-Surveillance Systems & Services COVID-19 Pandemic Mitigation Market – 2020-2024: Scenario B.. 271

28      E-Health COVID-19 Pandemic Mitigation Market – 2020-2024……………………………. 272

28.1     Pandemic E-Health Market Background…………………………………………………. 272

28.1.1         Introduction and Findings…………. 272

28.1.2         E-Health  Market: Conclusions….. 274

28.1.3         E-Health: Business Opportunities. 275

28.1.4         Key Vendors………………………….. 275

28.2     Global COVID-19 Pandemic Mitigation: E-Health Market – 2020-2024……………. 275

28.2.1         E-Health COVID-19 Pandemic Mitigation Market – 2020-2024: Scenario A…………………………….. 276

28.2.2         E-Health COVID-19 Pandemic Mitigation Market – 2020-2024: Scenario B…………………………….. 276

29      Blockchain Technologies COVID-19 Pandemic Mitigation Market – 2020-2024 277

29.1     Pandemic Blockchain Technologies Market Background………………………. 277

29.1.1         Introduction and Findings…………. 277

29.1.2         Blockchain in Healthcare………….. 279

29.1.3         Blockchain Applications……………. 279

29.1.4         Blockchain Technologies  Market: Conclusions…………………………… 282

29.1.5         Blockchain Technologies: Business Opportunities…………………………. 283

29.1.6         Key Vendors………………………….. 283

29.2     Global COVID-19 Pandemic Mitigation: Blockchain Technologies Market – 2020-2024………………………………………….. 284

29.2.1         Blockchain Technologies COVID-19 Pandemic Mitigation Market – 2020-2024: Scenario A……………………. 284

29.2.2         Blockchain Technologies COVID-19 Pandemic Mitigation Market – 2020-2024: Scenario B……………………. 285

30      Other ICT COVID-19 Pandemic Mitigation Market – 2020-2024……………………………. 286

30.1     Other Pandemics ICT Market Background…………………………………………………. 286

30.1.1         Introduction and Findings…………. 286

30.1.2         Other ICT  Market: Conclusions…. 288

30.1.3         Other ICT: Business Opportunities 289

30.1.4         Vendors………………………………… 289

30.2     Global COVID-19 Pandemic Mitigation: Other ICT Market – 2020-2024……….. 290

30.2.1         Other ICT COVID-19 Pandemic Mitigation Market – 2020-2024: Scenario A…………………………….. 291

30.2.2         Other ICT COVID-19 Pandemic Mitigation Market – 2020-2024: Scenario B…………………………….. 291

31      Noninvasive Ventilators COVID-19 Pandemic Mitigation Market – 2020-2024 293

31.1     Non-Invasive Ventilators Market Background…………………………………. 293

31.1.1         Introduction and Findings…………. 293

31.1.2         The U.S. HHS Procurement Contracts On Non-Invasive  Ventilators With Ten Vendors………………………….. 299

31.1.3         Helmet-Based Non-invasive  Ventilators…………………………….. 299

31.1.4         Non-invasive Ventilators Market: Conclusions…………………………… 300

31.1.5         Business Opportunities……………. 301

31.1.6         Non-invasive  Ventilators: Competitive Analysis: Barriers to Entry, Supplier Power, Buyer Power and Barriers to Substitution……………………………. 302

31.1.7         Key Vendors………………………….. 303

31.2     Global COVID-19 Pandemic Mitigation: Noninvasive Ventilators Market – 2020-2024………………………………………….. 303

31.2.1         Noninvasive Ventilators COVID-19 Pandemic Mitigation Market – 2020-2024: Scenario A……………………. 303

31.2.2         Noninvasive Ventilators COVID-19 Pandemic Mitigation Market – 2020-2024: Scenario B……………………. 304

32      Invasive Mechanical Ventilators COVID-19 Pandemic Mitigation Market – 2020-2024 305

32.1     Invasive Mechanical Ventilators Market Background…………………………………. 305

32.1.1         Introduction and Findings…………. 305

32.1.2         Challenges of Traditional Mechanical Ventilation Devices………………….. 312

32.1.2.1      Difficult To Expand Capacity And Limited Portability…………………. 312

32.1.2.2      Complex and Time Consuming To Administer Care……………………. 312

32.1.2.3      Difficult To Switch Between Therapies……………………………. 313

32.1.3         Invasive Mechanical Ventilators  Market: Conclusions………………… 313

32.1.4         Invasive Mechanical Ventilators: Business Opportunities……………. 313

32.1.5         Invasive Mechanical Ventilators: Competitive Analysis: Barriers to Entry, Supplier Power, Buyer Power and Barriers to Substitution………. 315

32.1.6         Key Vendors………………………….. 316

32.2     Global COVID-19 Pandemic Mitigation: Invasive Mechanical Ventilators Market – 2020-2024………………………………….. 316

32.2.1         Invasive Mechanical Ventilators COVID-19 Pandemic Mitigation Market – 2020-2024: Scenario A.. 316

32.2.2         Invasive Mechanical Ventilators COVID-19 Pandemic Mitigation Market – 2020-2024: Scenario B.. 317

33      Next Generation Ventilators COVID-19 Pandemic Mitigation Market – 2020-2024 318

33.1     Next Generation Ventilators Market Background…………………………………. 318

33.1.1         Introduction and Findings…………. 318

33.1.2         Next Generation Ventilators  Market: Conclusions…………………………… 319

33.1.3         Next Generation Ventilators: Business Opportunities…………………………. 320

33.1.4         Next Generation Ventilators: Competitive Analysis: Barriers to Entry, Supplier Power, Buyer Power and Barriers to Substitution………. 321

33.2     Global COVID-19 Pandemic Mitigation: Next Generation Ventilators Market – 2020-2024………………………………….. 322

33.2.1         Next Generation Ventilators COVID-19 Pandemic Mitigation Market – 2020-2024: Scenario A…………….. 322

33.2.2         Next Generation Ventilators COVID-19 Pandemic Mitigation Market – 2020-2024: Scenario B…………….. 322

34      Homecare “ICU” (Equipment, Software, Services) COVID-19 Pandemic Mitigation Market – 2020-2024……………………………. 324

34.1     COVID-19 Homecare “ICU” (Equipment, Software, Services) Market Background…………………………………………………. 324

34.1.1         Introduction and Findings…………. 324

34.1.2         WHO Protocol For COVID-19 Homecare……………………………… 327

34.1.3         Homecare Market: Conclusions…. 328

34.1.4         Homecare Business Opportunities 329

34.1.5         Homecare: Competitive Analysis: Barriers to Entry, Supplier Power, Buyer Power and Barriers to Substitution……………………………. 330

34.1.6         Key Vendors………………………….. 331

34.2     Global COVID-19 Pandemic Mitigation: Homecare “ICU”  (Equipment, Software, Services) Market – 2020-2024………… 331

34.2.1         Homecare “ICU”  (Equipment, Software, Services) COVID-19 Pandemic Mitigation Market – 2020-2024: Scenario A……………………. 332

34.2.2         Homecare “ICU”  (Equipment, Software, Services) COVID-19 Pandemic Mitigation Market – 2020-2024: Scenario B……………………. 332

34.3     Portable Ventilators Market Background…………………………………………………. 333

34.3.1         Introduction and Findings…………. 333

34.3.2         Portable Ventilators Market: Conclusions…………………………… 336

34.3.3         Key Vendors………………………….. 336

34.4     Global COVID-19 Pandemic Mitigation: Mobile Ventilators Market – 2020-2024…………………………………………………. 337

34.4.1         Mobile Ventilators COVID-19 Pandemic Mitigation Market – 2020-2024: Scenario A……………………. 337

34.4.2         Mobile Ventilators COVID-19 Pandemic Mitigation Market – 2020-2024: Scenario B……………………. 338

35      Surge Capacity Hospitals COVID-19 Pandemic Mitigation Market – 2020-2024 339

35.1     Surge Capacity Hospitals Market Background…………………………………. 339

35.1.1         Introduction and Findings…………. 339

35.1.2         Surge Capacity Hospitals Market: Conclusions…………………………… 342

35.2     Global COVID-19 Pandemic Mitigation: Surge Capacity Hospitals Market – 2020-2024………………………………………….. 342

35.2.1         Surge Capacity Hospitals COVID-19 Pandemic Mitigation Market – 2020-2024: Scenario A……………………. 342

35.2.2         Surge Capacity Hospitals COVID-19 Pandemic Mitigation Market – 2020-2024: Scenario B……………………. 343

36      Kidney Dialysis COVID-19 Pandemic Mitigation Market – 2020-2024…………….. 344

36.1     Kidney Dialysis Systems Market Background…………………………………. 344

36.1.1         Introduction and Findings…………. 344

36.1.2         Kidney Dialysis Systems  Market: Conclusions…………………………… 347

36.1.3         Kidney Dialysis Systems: Business Opportunities…………………………. 347

36.1.4         Key Vendors………………………….. 347

36.2     Global COVID-19 Pandemic Mitigation: Kidney Dialysis Market – 2020-2024… 348

36.2.1         Kidney DialysisCOVID-19 Pandemic Mitigation Market – 2020-2024: Scenario A…………………………….. 348

36.2.2         Kidney DialysisCOVID-19 Pandemic Mitigation Market – 2020-2024: Scenario B…………………………….. 349

37      Extracorporeal Membrane Oxygenation Procedures COVID-19 Pandemic Mitigation Market – 2020-2024……………………………. 350

37.1     Extracorporeal Membrane Oxygenation Procedures Market Background………. 350

37.1.1         Introduction and Findings…………. 350

37.1.2         The FDA Extracorporeal Membrane Oxygenation (ECMO) Policy……… 353

37.1.3         Extracorporeal Membrane Oxygenation Procedures  Market: Conclusions…………………………… 354

37.1.4         Extracorporeal Membrane Oxygenation Procedures: Business Opportunities…………………………. 355

37.1.5         Key Vendors………………………….. 355

37.2     Global COVID-19 Pandemic Mitigation: Extracorporeal Membrane Oxygenation Procedures Market – 2020-2024……… 356

37.2.1         Extracorporeal Membrane Oxygenation Procedures COVID-19 Pandemic Mitigation Market – 2020-2024: Scenario A……………………. 356

37.2.2         Extracorporeal Membrane Oxygenation Procedures COVID-19 Pandemic Mitigation Market – 2020-2024: Scenario B……………………. 356

38      Other Intensive Care Modalities COVID-19 Pandemic Mitigation Market – 2020-2024 358

38.1     Other Intensive Care Modalities Market Background…………………………………. 358

38.1.1         Introduction and Findings…………. 358

38.1.2         Other Intensive Care Modalities  Market: Conclusions………………… 361

38.2     Global COVID-19 Pandemic Mitigation: Other Intensive Care Modalities Market – 2020-2024………………………………….. 362

38.2.1         Other Intensive Care Modalities COVID-19 Pandemic Mitigation Market – 2020-2024: Scenario A.. 362

38.2.2         Other Intensive Care Modalities COVID-19 Pandemic Mitigation Market – 2020-2024: Scenario B.. 362

39      Gowns Manufacturing Plants COVID-19 Pandemic Mitigation Market – 2020-2024 364

39.1     PPE Gowns Manufacturing Plants Market Background…………………………………. 364

39.1.1         Introduction and Findings…………. 364

39.1.2         Gowns Manufacturing Plants  Market: Conclusions…………………………… 366

39.1.3         Gowns Manufacturing Plants: Business Opportunities……………. 366

39.2     Global COVID-19 Pandemic Mitigation: Gowns Manufacturing Plants Market – 2020-2024………………………………….. 366

39.2.1         Gowns Manufacturing Plants COVID-19 Pandemic Mitigation Market – 2020-2024: Scenario A…………….. 367

39.2.2         Gowns Manufacturing Plants COVID-19 Pandemic Mitigation Market – 2020-2024: Scenario B…………….. 367

40      Gloves Manufacturing Plants COVID-19 Pandemic Mitigation Market – 2020-2024 369

40.1     Medical PPE Gloves Manufacturing Plants Market Background……………… 369

40.1.1         Introduction and Findings…………. 369

40.1.2         Medical PPE Gloves Manufacturing Plants  Market: Conclusions……… 371

40.1.3         Medical PPE Gloves Manufacturing Plants: Business Opportunities….. 372

40.2     Global COVID-19 Pandemic Mitigation: Gloves Manufacturing Plants Market – 2020-2024………………………………….. 372

40.2.1         Gloves Manufacturing Plants COVID-19 Pandemic Mitigation Market – 2020-2024: Scenario A…………….. 373

40.2.2         Gloves Manufacturing Plants COVID-19 Pandemic Mitigation Market – 2020-2024: Scenario B…………….. 373

41      Face Masks Manufacturing Plants COVID-19 Pandemic Mitigation Market – 2020-2024 375

41.1     Face Masks Manufacturing Plants Market Background…………………………………. 375

41.1.1         Introduction and Findings…………. 375

41.1.2         N95 Respirators Manufacturing…. 383

41.1.3         Face Masks Manufacturing Plants  Market: Conclusions………………… 385

41.1.4         Face Masks Manufacturing Plants: Business Opportunities……………. 386

41.1.5         Key Vendors………………………….. 386

41.2     Global COVID-19 Pandemic Mitigation: Face Masks Manufacturing Plants Market – 2020-2024………………………………… 387

41.2.1         Face Masks Manufacturing Plants COVID-19 Pandemic Mitigation Market – 2020-2024: Scenario A.. 387

41.2.2         Face Masks Manufacturing Plants COVID-19 Pandemic Mitigation Market – 2020-2024: Scenario B.. 387

42      Face Shields Manufacturing Plants COVID-19 Pandemic Mitigation Market – 2020-2024 389

42.1     Face Shields Manufacturing Plants Market Background………………………. 389

42.1.1         Introduction and Findings…………. 389

42.2     Global COVID-19 Pandemic Mitigation: Face Shields Manufacturing Plants Market – 2020-2024……………………… 391

42.2.1         Face Shields Manufacturing Plants COVID-19 Pandemic Mitigation Market – 2020-2024: Scenario A.. 391

42.2.2         Face Shields Manufacturing Plants COVID-19 Pandemic Mitigation Market – 2020-2024: Scenario B.. 392

43      Serologic Test Kits Manufacturing Plants COVID-19 Pandemic Mitigation Market – 2020-2024…………………………………………. 393

43.1     Serologic Test Kits Manufacturing Plants Market Background………………………. 393

43.1.1         Introduction and Findings…………. 393

43.1.2         Serologic Test Kits Manufacturing Plants  Market: Conclusions……… 394

43.2     Global COVID-19 Pandemic Mitigation: Serologic Test Kits Manufacturing Plants Market – 2020-2024……………………… 395

43.2.1         Serologic Test Kits Manufacturing Plants COVID-19 Pandemic Mitigation Market – 2020-2024: Scenario A.. 395

43.2.2         Serologic Test Kits Manufacturing Plants COVID-19 Pandemic Mitigation Market – 2020-2024: Scenario B.. 395

44      Melt-Blown PPE Fabric Manufacturing Plants COVID-19 Pandemic Mitigation Market – 2020-2024……………………………. 397

44.1     Melt-Blown PPE Fabric Manufacturing Plants Market Background……………… 397

44.1.1         Introduction and Findings…………. 397

44.1.2         Melt-Blown PPE Fabric. Manufacturing  Plants Market: Conclusions…………………………… 401

44.2     Global COVID-19 Pandemic Mitigation: Melt-Blown PPE Fabric Manufacturing Plants Market – 2020-2024…………….. 402

44.2.1         Melt-Blown PPE Fabric Manufacturing Plants COVID-19 Pandemic Mitigation Market – 2020-2024: Scenario A.. 403

44.2.2         Melt-Blown PPE Fabric Manufacturing Plants COVID-19 Pandemic Mitigation Market – 2020-2024: Scenario B.. 403

45      Spun-Bond PPE Fabric Manufacturing Plants COVID-19 Pandemic Mitigation Market – 2020-2024……………………………. 405

45.1     Spun-Bond PPE Fabric Manufacturing Plants Market Background……………… 405

45.1.1         Introduction and Findings…………. 405

45.1.2         Spun-Bond PPE Fabric Manufacturing Plants  Market: Conclusions……… 406

45.2     Global COVID-19 Pandemic Mitigation: Spun-Bond PPE Fabric Manufacturing Plants Market – 2020-2024…………….. 408

45.2.1         Spun-Bond PPE Fabric Manufacturing Plants COVID-19 Pandemic Mitigation Market – 2020-2024: Scenario A.. 408

45.2.2         Spun-Bond PPE Fabric Manufacturing Plants COVID-19 Pandemic Mitigation Market – 2020-2024: Scenario B.. 408

46      Self-collection PCR Test Kits Manufacturing Plants COVID-19 Pandemic Mitigation Market – 2020-2024……………………………. 410

46.1     Market Background………………………. 410

46.2     Global COVID-19 Pandemic Mitigation: Self-collection PCR Test Kits Manufacturing Plants Market – 2020-2024…………………………………………………. 411

46.2.1         Self-collection PCR Test Kits Manufacturing Plants COVID-19 Pandemic Mitigation Market – 2020-2024: Scenario A……………………. 411

46.2.2         Self-collection PCR Test Kits Manufacturing Plants COVID-19 Pandemic Mitigation Market – 2020-2024: Scenario B……………………. 412

47      Ventilators Manufacturing Plants COVID-19 Pandemic Mitigation Market – 2020-2024 413

47.1     Ventilators Manufacturing Plants Market Background…………………………………. 413

47.1.1         Introduction and Findings…………. 413

47.1.2         Ventilators Manufacturing Plants  Market: Conclusions………………… 416

47.2     Global COVID-19 Pandemic Mitigation: Ventilators Manufacturing Plants Market – 2020-2024………………………………….. 417

47.2.1         Ventilators Manufacturing Plants COVID-19 Pandemic Mitigation Market – 2020-2024: Scenario A.. 418

47.2.2         Ventilators Manufacturing Plants COVID-19 Pandemic Mitigation Market – 2020-2024: Scenario B.. 418

48      PCR Reagents Manufacturing Plants COVID-19 Pandemic Mitigation Market – 2020-2024…………………………………………. 419

48.1     Global COVID-19 Pandemic Mitigation: PCR Reagents Manufacturing Plants Market – 2020-2024……………………… 419

48.1.1         PCR Reagents Manufacturing Plants COVID-19 Pandemic Mitigation Market – 2020-2024: Scenario A.. 419

48.1.2         PCR Reagents Manufacturing Plants COVID-19 Pandemic Mitigation Market – 2020-2024: Scenario B.. 420

49      PCR Systems Manufacturing Plants COVID-19 Pandemic Mitigation Market – 2020-2024 421

49.1     Global COVID-19 Pandemic Mitigation: PCR Systems Manufacturing Plants Market – 2020-2024……………………… 421

49.1.1         PCR Systems Manufacturing Plants COVID-19 Pandemic Mitigation Market – 2020-2024: Scenario A.. 421

49.1.2         PCR Systems Manufacturing Plants COVID-19 Pandemic Mitigation Market – 2020-2024: Scenario B.. 422

50      Nose & Mouth Swabs Manufacturing Plants COVID-19 Pandemic Mitigation Market – 2020-2024…………………………………………. 423

50.1     Nose & Mouth Swabs Manufacturing Plants Market Background……………… 423

50.1.1         Introduction and Findings…………. 423

50.1.2         Swabs Manufacturing Plants  Market: Conclusions…………………………… 425

50.1.3         Swabs Manufacturing Plants: Business Opportunities……………. 426

50.2     Global COVID-19 Pandemic Mitigation: Nose & Mouth Swabs Manufacturing Plants Market – 2020-2024…………….. 426

50.2.1         Nose & Mouth Swabs Manufacturing Plants COVID-19 Pandemic Mitigation Market – 2020-2024: Scenario A.. 427

50.2.2         Nose & Mouth Swabs Manufacturing Plants COVID-19 Pandemic Mitigation Market – 2020-2024: Scenario B.. 427

51      Medical Glass & Other Manufacturing Plants COVID-19 Pandemic Mitigation Market – 2020-2024……………………………. 428

51.1     Global COVID-19 Pandemic Mitigation: Medical Glass & Other Manufacturing Plants Market – 2020-2024…………….. 428

51.1.1         Medical Glass & Other Manufacturing PlantsCOVID-19 Pandemic Mitigation Market – 2020-2024: Scenario A.. 428

51.1.2         Medical Glass & Other Manufacturing PlantsCOVID-19 Pandemic Mitigation Market – 2020-2024: Scenario B.. 429

52      R&D Equipment & Consumables COVID-19 Pandemic Mitigation Market – 2020-2024 430

52.1     Global COVID-19 Pandemic Mitigation: R&D Equipment & Consumables Market – 2020-2024………………………………….. 430

52.1.1         R&D Equipment & Consumables COVID-19 Pandemic Mitigation Market – 2020-2024: Scenario A.. 430

52.1.2         R&D Equipment & Consumables COVID-19 Pandemic Mitigation Market – 2020-2024: Scenario B.. 431

53      Medical Glass and Other Products & Services COVID-19 Pandemic Mitigation Market – 2020-2024……………………………. 432

53.1     Medical Glass and Other Products & Services Market Background………….. 432

53.1.1         Medical Glass Introduction and Findings………………………………… 432

53.1.2         Medical Glass Market: Conclusions……………………………………………. 433

53.1.3         Key Medical Glass Vendors………. 433

53.2     Global COVID-19 Pandemic Mitigation: Medical Glass and Other Products & Services Market – 2020-2024…………. 433

53.2.1         Medical Glass and Other Products & Services COVID-19 Pandemic Mitigation Market – 2020-2024: Scenario A…………………………….. 434

53.2.2         Medical Glass and Other Products & Services COVID-19 Pandemic Mitigation Market – 2020-2024: Scenario B…………………………….. 434


[Back to top]

COVID-19 Pandemic Mitigation Products Market – 2020-2024: Volume 3

Download the PDF

VERTICAL MARKETS…………………………………. 14

1         Hospitals and Surge Hospitals COVID-19 Pandemic Mitigation Market – 2020-2024.. 14

1.1        Market Background………………………… 14

1.2        Global COVID-19 Pandemic Mitigation: Hospitals and Surge Hospitals Market – 2020-2024……………………………………. 14

1.2.1            COVID-19 Pandemic Mitigation Hospitals and Surge Hospitals Market: Scenario A…………………… 15

1.2.2            COVID-19 Pandemic Mitigation Hospitals and Surge Hospitals Market: Scenario B…………………… 16

1.2.3            Hospitals and Surge Hospitals Market: Scenarios Comparison…… 18

2         Clinical Labs COVID-19 Pandemic Mitigation Market – 2020-2024………………. 19

2.1        Market Background………………………… 19

2.2        Global COVID-19 Pandemic Mitigation: Clinical Labs Market – 2020-2024……… 19

2.2.1            COVID-19 Pandemic Mitigation Clinical Labs Market: Scenario A…. 20

2.2.2            COVID-19 Pandemic Mitigation Clinical Labs Market: Scenario B…. 21

2.2.3            Clinical Labs Market: Scenarios Comparison…………………………….. 23

3         Clinics COVID-19 Pandemic Mitigation Market – 2020-2024……………………………… 24

3.1        Market Background………………………… 24

3.2        Global COVID-19 Pandemic Mitigation: Clinics Market – 2020-2024……………… 24

3.2.1            COVID-19 Pandemic Mitigation Clinics Market: Scenario A…………. 25

3.2.2            COVID-19 Pandemic Mitigation Clinics Market: Scenario B…………. 26

3.2.3            Clinics Market: Scenarios Comparison……………………………………………… 28

4         Emergency Medical Services (EMS) COVID-19 Pandemic Mitigation Market – 2020-2024 29

4.1        Market Background………………………… 29

4.2        Global COVID-19 Pandemic Mitigation: Emergency Medical Services (EMS) Market – 2020-2024……………………….. 29

4.2.1            COVID-19 Pandemic Mitigation Emergency Medical Services (EMS) Market: Scenario A…………………… 30

4.2.2            COVID-19 Pandemic Mitigation Emergency Medical Services (EMS) Market: Scenario B…………………… 31

4.2.3            Emergency Medical Services Market: Scenarios Comparison………………. 33

5         Homecare & Nursing Homes COVID-19 Pandemic Mitigation Market – 2020-2024.. 34

5.1        Market Background………………………… 34

5.2        Global COVID-19 Pandemic Mitigation: Homecare & Nursing Homes Market – 2020-2024……………………………………. 34

5.2.1            COVID-19 Pandemic Mitigation Homecare & Nursing Homes Market: Scenario A………………………………. 35

5.2.2            COVID-19 Pandemic Mitigation Homecare & Nursing Homes Market: Scenario B………………………………. 36

5.2.3            Homecare & Nursing Homes Market: Scenarios Comparison………………. 38

6         Research Bodies COVID-19 Pandemic Mitigation Market – 2020-2024………………. 39

6.1        Market Background………………………… 39

6.2        Global COVID-19 Pandemic Mitigation: Research Bodies Market – 2020-2024.. 39

6.2.1            COVID-19 Pandemic Mitigation Research Bodies Market: Scenario A……………………………………………… 40

6.2.2            COVID-19 Pandemic Mitigation Research Bodies Market: Scenario B……………………………………………… 41

6.2.3            Research Bodies Market: Scenarios Comparison…………………………….. 43


REGIONAL MARKETS………………………………… 44

7         North America COVID-19 Pandemic Mitigation Market – 2020-2024……………….. 44

7.1        North America Vertical Markets – 2020-2024……………………………………………. 44

7.1.1            North America COVID-19 Pandemic Mitigation Market: Scenario A……… 44

7.1.2            North America COVID-19 Pandemic Mitigation Market: Scenario B……… 46

7.1.3            Scenarios Comparison………………. 48

7.2        North America COVID-19 Pandemic Mitigation Market by Revenue Source – 2020-2024……………………………………. 49

7.2.1            North America COVID-19 Pandemic Mitigation Products & Services Market: Scenario A…………………… 49

7.2.2            North America COVID-19 Pandemic Mitigation Products & Services Market: Scenario B…………………… 51

8         Europe COVID-19 Pandemic Mitigation Market – 2020-2024………………………………. 53

8.1        Europe Vertical Markets – 2020-2024… 53

8.1.1            Europe COVID-19 Pandemic Mitigation Market: Scenario A……… 53

8.1.2            Europe COVID-19 Pandemic Mitigation Market: Scenario B……… 55

8.1.3            Scenarios Comparison………………. 57

8.2        Europe COVID-19 Market by Revenue Source – 2020-2024……………………….. 58

8.2.1            Europe COVID-19 Pandemic Mitigation Products & Services Market: Scenario A…………………… 58

8.2.2            Europe COVID-19 Pandemic Mitigation Products & Services Market: Scenario B…………………… 60

9         Asia-Pacific COVID-19 Pandemic Mitigation Market – 2020-2024………………………………. 61

9.1        Asia-Pacific Vertical Markets – 2020-2024…………………………………………………… 61

9.1.1            Asia-Pacific COVID-19 Pandemic Mitigation Market: Scenario A……… 61

9.1.2            Asia-Pacific COVID-19 Pandemic Mitigation Market: Scenario B……… 63

9.1.3            Scenarios Comparison………………. 64

9.2        Asia-Pacific COVID-19 Market by Revenue Source – 2020-2024………….. 65

9.2.1            Asia-Pacific COVID-19 Pandemic Mitigation Products & Services Market: Scenario A…………………… 65

9.2.2            Asia-Pacific COVID-19 Pandemic Mitigation Products & Services Market: Scenario B…………………… 67

10      MEA & Latin America COVID-19 Pandemic Mitigation Market – 2020-2024……………….. 69

10.1     MEA & Latin America Vertical Markets – 2020-2024……………………………………. 69

10.1.1         MEA & Latin America COVID-19 Pandemic Mitigation Market: Scenario A…………………………………………… 69

10.1.2         MEA & Latin America COVID-19 Pandemic Mitigation Market: Scenario B…………………………………………… 71

10.1.3         Scenarios Comparison………………. 73

10.2     MEA & Latin America COVID-19 Market by Revenue Source – 2020-2024……… 74

10.2.1         MEA & Latin America COVID-19 Pandemic Mitigation Products & Services Market: Scenario A………. 74

10.2.2         MEA & Latin America COVID-19 Pandemic Mitigation Products & Services Market: Scenario B………. 76


NATIONAL MARKETS…………………………………. 78

11      USA COVID-19 Pandemic Mitigation Market – 2020-2024…………………………………………. 78

11.1     Market Background………………………… 78

11.2     USA COVID-19 Pandemic Mitigation Market Scenarios– 2020-2024………….. 79

12      Canada COVID-19 Pandemic Mitigation Market – 2020-2024………………………………. 81

12.1     Market Background………………………… 81

12.2     Canada COVID-19 Pandemic Mitigation Market Scenarios– 2020-2024………….. 82

13      U.K. COVID-19 Pandemic Mitigation Market – 2020-2024…………………………………………. 84

13.1     Market Background………………………… 84

13.2     U.K. COVID-19 Pandemic Mitigation Market Scenarios– 2020-2024………….. 85

14      Germany COVID-19 Pandemic Mitigation Market – 2020-2024………………………………. 87

14.1     Market Background………………………… 87

14.2     Germany COVID-19 Pandemic Mitigation Market Scenarios– 2020-2024………….. 88

15      France COVID-19 Pandemic Mitigation Market – 2020-2024………………………………. 90

15.1     Market Background………………………… 90

15.2     France COVID-19 Pandemic Mitigation Market Scenarios– 2020-2024………….. 91

16      Italy COVID-19 Pandemic Mitigation Market – 2020-2024…………………………………………. 93

16.1     Market Background………………………… 93

16.2     Italy COVID-19 Pandemic Mitigation Market Scenarios– 2020-2024………….. 94

17      Rest of Europe COVID-19 Pandemic Mitigation Market – 2020-2024……………….. 96

18      India COVID-19 Pandemic Mitigation Market – 2020-2024…………………………………………. 98

18.1     Market Background………………………… 98

18.2     India COVID-19 Pandemic Mitigation Market Scenarios– 2020-2024………….. 99

19      China COVID-19 Pandemic Mitigation Market – 2020-2024…………………………….. 101

19.1     Market Background………………………. 101

19.2     China COVID-19 Pandemic Mitigation Market Scenarios– 2020-2024………… 102

20      South Korea COVID-19 Pandemic Mitigation Market – 2020-2024…………………………….. 104

20.1     Market Background………………………. 104

20.2     South Korea COVID-19 Pandemic Mitigation Market Scenarios– 2020-2024…………………………………………………. 105

21      Japan COVID-19 Pandemic Mitigation Market – 2020-2024…………………………….. 107

21.1     Market Background………………………. 107

21.2     Japan COVID-19 Pandemic Mitigation Market Scenarios– 2020-2024………… 108

22      Rest of Asia-Pacific COVID-19 Pandemic Mitigation Market – 2020-2024……………… 110

23      ROW COVID-19 Pandemic Mitigation Market – 2020-2024……………………………………….. 112


[Back to top]

Global Homeland Security & Public Safety Market – 2020-2024: Volume 4

Download the PDF

MAJOR VENDORS……………………………………….. 8

1         Vendor 1………………………………………………. 8

1.1        Company Profile……………………………… 8

1.2        2017- 2019 Financials………………………. 8

1.3        COVID-19 Mitigation Activities &  Products………………………………………… 9

2         Vendor 2…………………………………………….. 11

2.1        Company Profile……………………………. 11

2.2        2017- 2019 Financials…………………….. 11

2.3        COVID-19 Mitigation Activities &  Products………………………………………. 12

3         Vendor 3…………………………………………….. 13

3.1        Company Profile……………………………. 13

3.2        2017- 2018 Financials…………………….. 13

3.3        COVID-19 Mitigation Activities &  Products………………………………………. 14

4         Vendor 4…………………………………………….. 15

4.1        Company Profile……………………………. 15

4.2        2017- 2018 Financials…………………….. 15

4.3        COVID-19 Mitigation Activities &  Products………………………………………. 16

5         Vendor 5…………………………………………….. 17

5.1        Company Profile……………………………. 17

5.2        2017- 2019 Financials…………………….. 17

5.3        COVID-19 Mitigation Activities &  Products………………………………………. 17

6         Vendor 6…………………………………………….. 18

6.1        Company Profile……………………………. 18

6.2        2017- 2018 Financials…………………….. 18

6.3        COVID-19 Mitigation Activities &  Products………………………………………. 18

7         Vendor 7…………………………………………….. 19

7.1        Company Profile……………………………. 19

7.2        2017- 2019 Financials…………………….. 19

7.3        COVID-19 Mitigation Activities &  Products………………………………………. 20

8         Vendor 8…………………………………………….. 21

8.1        Company Profile……………………………. 21

8.2        2017- 2019 Financials…………………….. 21

8.3        COVID-19 Mitigation Activities &  Products………………………………………. 22

9         Vendor 9…………………………………………….. 23

9.1        Company Profile……………………………. 23

9.2        2017- 2019 Financials…………………….. 24

9.3        COVID-19 Mitigation Activities &  Products………………………………………. 24

10      Vendor 10…………………………………………… 26

10.1     Company Profile……………………………. 26

10.2     2017- 2019 Financials…………………….. 26

10.3     COVID-19 Mitigation Activities &  Products………………………………………. 26

11      Vendor 11…………………………………………… 27

11.1     Company Profile……………………………. 27

11.2     2017- 2019 Financials…………………….. 27

11.3     COVID-19 Mitigation Activities &  Products………………………………………. 28

12      Vendor 12…………………………………………… 29

12.1     Company Profile……………………………. 29

12.2     2017- 2019 Financials…………………….. 30

12.3     COVID-19 Mitigation Activities &  Products………………………………………. 30

13      Vendor 13…………………………………………… 31

13.1     Company Profile……………………………. 31

13.2     2017- 2019 Financials…………………….. 31

13.3     COVID-19 Mitigation Activities &  Products………………………………………. 32

14      Vendor 14…………………………………………… 33

14.1     Company Profile……………………………. 33

14.2     2017- 2019 Financials…………………….. 34

14.3     COVID-19 Mitigation Activities &  Products………………………………………. 34

15      Vendor 15…………………………………………… 35

15.1     Company Profile……………………………. 35

15.2     2017- 2019 Financials…………………….. 36

15.3     COVID-19 Mitigation Activities &  Products………………………………………. 36

16      Vendor 16…………………………………………… 37

16.1     Company Profile……………………………. 37

16.2     2017- 2019 Financials…………………….. 38

16.3     COVID-19 Mitigation Activities &  Products………………………………………. 38

17      Vendor 17…………………………………………… 40

17.1     Company Profile……………………………. 40

17.2     2017- 2019 Financials…………………….. 40

17.3     COVID-19 Mitigation Activities &  Products………………………………………. 41

18      Vendor 18…………………………………………… 42

18.1     Company Profile……………………………. 42

18.2     2017- 2019 Financials…………………….. 42

18.3     COVID-19 Mitigation Activities &  Products………………………………………. 43

19      Vendor 19…………………………………………… 44

19.1     Company Profile……………………………. 44

19.2     2017- 2019 Financials…………………….. 44

19.3     COVID-19 Mitigation Activities &  Products………………………………………. 44

20      Vendor 20…………………………………………… 45

20.1     Company Profile……………………………. 45

20.2     2016- 2018 Financials…………………….. 45

20.3     COVID-19 Mitigation Activities &  Products………………………………………. 46

21      Vendor 21…………………………………………… 46

21.1     Company Profile……………………………. 47

21.2     2017- 2019 Financials…………………….. 47

21.3     COVID-19 Mitigation Activities &  Products………………………………………. 48

22      Vendor 22…………………………………………… 49

22.1     Company Profile……………………………. 49

22.2     2017- 2019 Financials…………………….. 49

22.3     COVID-19 Mitigation Activities &  Products………………………………………. 50

23      Vendor 23…………………………………………… 51

23.1     Company Profile……………………………. 51

23.2     2017- 2019 Financials…………………….. 51

23.3     COVID-19 Mitigation Activities &  Products………………………………………. 52

24      Vendor 24…………………………………………… 52

24.1     Company Profile……………………………. 53

24.2     2017- 2019 Financials…………………….. 53

24.3     COVID-19 Mitigation Activities &  Products………………………………………. 54

25      Vendor 25…………………………………………… 54

25.1     Company Profile……………………………. 55

25.2     2017- 2019 Financials…………………….. 55

25.3     COVID-19 Mitigation Activities &  Products………………………………………. 56

26      Vendor 26…………………………………………… 56

26.1     Company Profile……………………………. 57

26.2     2017- 2019 Financials…………………….. 57

26.3     COVID-19 Mitigation Activities &  Products………………………………………. 57

27      Vendor 27…………………………………………… 59

27.1     Company Profile……………………………. 59

27.2     2017- 2019 Financials…………………….. 60

27.3     COVID-19 Mitigation Activities &  Products………………………………………. 60

28      Vendor 28…………………………………………… 61

28.1     Company Profile……………………………. 61

28.2     2017- 2019 Financials…………………….. 62

28.3     COVID-19 Mitigation Activities &  Products………………………………………. 62

29      Vendor 29…………………………………………… 64

29.1     Company Profile……………………………. 64

29.2     2017- 2019 Financials…………………….. 64

29.3     COVID-19 Mitigation Activities &  Products………………………………………. 65

30      Vendor 30…………………………………………… 66

30.1     Company Profile……………………………. 66

30.2     2017- 2019 Financials…………………….. 66

30.3     COVID-19 Mitigation Activities &  Products………………………………………. 66

31      Vendor 31…………………………………………… 67

31.1     Company Profile……………………………. 67

31.2     2017- 2019 Financials…………………….. 67

31.3     COVID-19 Mitigation Activities &  Products………………………………………. 67

32      Vendor 32…………………………………………… 68

32.1     Company Profile……………………………. 68

32.2     2017- 2019 Financials…………………….. 68

32.3     COVID-19 Mitigation Activities &  Products………………………………………. 69

33      Vendor 33…………………………………………… 69

33.1     Company Profile……………………………. 70

33.2     2017- 2019 Financials…………………….. 70

33.3     COVID-19 Mitigation Activities &  Products………………………………………. 71

34      Vendor 34…………………………………………… 71

34.1     Company Profile……………………………. 72

34.2     2008- 2010 Financials…………………….. 73

34.3     COVID-19 Mitigation Activities &  Products………………………………………. 73

35      Vendor 35…………………………………………… 74

35.1     Company Profile……………………………. 74

35.2     2017- 2019 Financials…………………….. 74

35.3     COVID-19 Mitigation Activities &  Products………………………………………. 75

36      Vendor 36…………………………………………… 75

36.1     Company Profile……………………………. 76

36.2     2017- 2019 Financials…………………….. 76

36.3     COVID-19 Mitigation Activities &  Products………………………………………. 77

37      Vendor 37…………………………………………… 78

37.1     Company Profile……………………………. 78

37.2     2013- 2015 Financials…………………….. 78

37.3     COVID-19 Mitigation Activities &  Products………………………………………. 79


[Back to top]

COVID-19 Pandemic Mitigation Products Market – 2020-2024: Volume 4

Download the PDF

APPENDICES…………………………………………….. 10

1         Appendix 1: Differences & Similarities Between Common Flu and Coronavirus… 10

1.1        Similarities:…………………………………… 10

1.2        Differences…………………………………… 10

2         Appendix 2: Coronavirus Personal Protective Equipment (PPE) for Healthcare Personnel…………………………………………… 12

2.1        Introduction…………………………………… 12

2.2        Conclusions………………………………….. 13

2.3        Findings Summary…………………………. 15

2.4     Background………………………………….. 19

2.4.1            Description of the Condition……….. 19

2.4.2            Description of the Intervention…….. 20

2.4.3            How the Intervention Might Work…. 23

2.4.4            Why it Is Important To Do This Review…………………………………… 23

2.4.5            Summary………………………………… 24

3         Appendix 3: CDC Strategies for Optimizing the Supply of Eye Protection………………… 26

3.1        Introduction…………………………………… 26

3.1.1    Contingency Capacity Strategies………. 27

3.1.2         Extended Use Of Eye Protection…. 27

3.1.3         Crisis Capacity Strategies………….. 28

3.1.4         Selected Options for Reprocessing Eye Protection…………………………. 29

4         Appendix 4: CDC Strategies for Optimizing the Supply of Isolation Gowns……………… 29

4.1        Purpose……………………………………….. 29

4.2        Conventional Capacity Strategies……… 31

4.3        Contingency Capacity Strategies………. 31

4.4        Crisis Capacity Strategies……………….. 32

4.5        Extended Use of Isolation Gowns……… 33

4.5.1         Re-use of Cloth Isolation Gowns…. 33

4.5.2         Prioritize Gowns……………………….. 33

4.5.3         When No Gowns Are Available…… 34

5         Appendix 5: CDC Strategy for Optimizing the Supply of Facemasks…………………….. 35

5.1        Purpose……………………………………….. 35

5.2        Conventional Capacity Strategies……… 36

5.3        Contingency Capacity Strategies………. 36

5.4        When No Facemasks Are Available, Options Include……………………………… 38

6         Appendix 6:  CDC Strategies for Optimizing the Supply of N95 Respirators……………… 40

7         Appendix 7: CDC Adult Vaccine Price List 43

7.1        CDC Vaccine 2020-2021 Price List……. 43

7.2        CDC Influenza Vaccine 2020-2021 Price List……………………………………………… 44

8         Appendix 8: The CDC COVID-19 Bio-Safety Guidelines………………………………………….. 46

8.1        The CDC  Safety Practices for Critical Infrastructure Workers Exposed to a Person with Suspected or Confirmed COVID-19…………………………………….. 46

8.2        Use of Cloth Face Coverings……………. 46

8.3        The Emergency Medical Services Guidance……………………………………… 47

8.4        Recommendations for 911 PSAPs…….. 48

8.4.1            Modified Caller Queries……………… 48

8.5        EMS Clinicians and Medical First Responders………………………………….. 49

8.5.1            Patient assessment…………………… 49

8.6        Recommended Personal Protective Equipment……………………………………. 50

8.7        Precautions for Aerosol-Generating Procedures…………………………………… 51

8.8        EMS Transport of a PUI or Patient with Confirmed COVID-19 to a Healthcare Facility…………………………………………. 51

8.9        Documentation Of Patient Care………… 52

8.10     Cleaning EMS Transport Vehicles after Transporting a PUI or Patient with Confirmed COVID-19……………………… 53

8.11     Measures by EMS Clinicians After Caring for a PUI or Patient with Confirmed COVID-19…………………………………….. 54

8.12     EMS Employer Responsibilities………… 55

9         Appendix 9: The 2020 Global Desperation to Protect Medical Workers……………………… 56

10      Appendix 10: Disinfection Procedures for COVID-19……………………………………………. 59

10.1     Disinfection for Floor and Walls………… 59

10.2     Disinfection of Object Surfaces…………. 59

10.3     Air Disinfection………………………………. 59

10.4     Disposal of Fecal Matter and Sewage… 59

10.5     Disposal Procedures for Spills of COVID-19 Patient Blood/Fluids…………………… 60

11      Appendix 11: Breakdown of the COVID-19 USA Medical Services Stimulus April 2020 61

11.1     Public Health and Social Services Emergency Fund – March 2020………… 61

11.2     For Advance Construction, Manufacture, And Purchase Of Vaccines And Therapeutic Delivery………………………. 61

11.3     Telehealth, Poison Control Centers, And The Ryan White HIV/AIDS Program….. 61

11.4     National Institutes of Health……………… 62

11.5     Substance Abuse and Mental Health Services Administration…………………… 62

11.6     Administration for Children and Families…………………………………………………… 63

11.7     Veterans Health Administration………… 63

12      Appendix 12: European Preparedness Against Emerging Epidemics……………….. 64

13      Appendix 13: Development and Regulation by the CDC and FDA Diagnostic Testing for COVID-19……………………………………………. 66

13.1     Introduction…………………………………… 66

13.2     Diagnostic Tests……………………………. 69

13.1.1         IVD Tests………………………………… 69

13.1.2         LDT Tests……………………………….. 69

13.1.3         How are IVD Tests Regulated?…… 69

13.1.4         How are LDTs Regulated?…………. 70

13.1.5         What is CLIA and How Is It Involved in LDT Regulation?…………………… 70

13.1.6         How are IVDs Regulated by the FDA During an Emergency Such as the Outbreak of COVID-19?…………….. 71

13.1.7         How Does the Emergency Use Authority Apply to LDTs if They Are Generally Exempted from Premarket Requirements?………………………… 71

13.1.8         How Does the CDC’s COVID-19 Diagnostic Test Work?………………. 72

13.1.9         What Type of IVD is the CDC’s Test and Who May Carry it Out?………… 73

13.1.10       What Is the Role of the Commercial Manufacturer IDT in the Development and Distribution of the CDC’s Test Kit?………………………………………… 74

13.1.11       What Quality Problems Did the CDC’s Test Experience on Rollout to the State and Local Public Health Laboratories?…………………………… 74

13.1.12       What Steps did the FDA Take to Expand Testing Capacity in Response to the Problems with the CDC’s Test?……………………………………………… 75

14      Appendix 14: The U.S. Defense Production Act: Example FEMA COVID-19 Supply Chain Stabilization………………………………. 76

15      Appendix 15:  The Global Research Collaboration for Infectious Disease Preparedness (GLOPID-R)……………………. 79

16      Appendix 16: Comparing Clinical COVID-19 Data by Nation……………………………………. 80

16.1     Introduction…………………………………… 80

16.2     Counting Deaths Protocols………………. 80

16.3     National Death Rates……………………… 81

16.4     National Political Factors…………………. 82

16.5     National Testing Protocols……………….. 83

16.6     Conclusions: Comparisons are Difficult. 84

17      Appendix 17: Home Healthcare IT…………. 85

17.1     Introduction…………………………………… 85

17.2     Online Bots…………………………………… 86

17.3     Home Telehealth……………………………. 86

17.4     Telemedicine Billing……………………….. 88

17.5     Commercial Insurance……………………. 88

18      Appendix 18: The Difference between PCR and Antibody Tests……………………………… 90

19      Appendix 19: COVID-19 Pandemic Global Economic Effects- 2020-2021……………….. 91

19.1     Introduction…………………………………… 91

19.2     Economic Effects…………………………… 93

19.3     USA…………………………………………….. 95

19.4     Europe…………………………………………. 96

19.5     The UK………………………………………… 97

19.6     Japan………………………………………….. 98

19.7     China…………………………………………… 98

19.8     The IMF……………………………………….. 98

19.9     The World Bank…………………………….. 99

19.10  Emerging Markets………………………… 100

19.11  Other Sectors………………………………. 101

20      Appendix 20: COVID-19 Tests…………….. 103

20.1     COVID-19 Tests Sensitivity and Specificity…………………………………… 103

20.2     RT-PCR tests………………………………. 104

20.3     Antibody Tests…………………………….. 105

20.4     Other Diagnostic Options………………. 108

20.5     Procurement of Test Kits and Consumables………………………………. 108

20.6     Annex A: Test Kit Options from WHO Diagnostics Consortium…………………. 109

21      Appendix 21: Rapid Communication on the Role of the GeneXpert® Platform for Rapid Molecular Testing for SARS-CoV-2 in the WHO European Region………………………. 118

22      Appendix 22: Abbreviations……………….. 125

23      Appendix 23: Glossary………………………. 129

24      Appendix 24: Bibliography…………………. 136

25      Research Methodology………………………. 242

25.1     Scope………………………………………… 242

25.2     Research Methodology………………….. 242

26      Disclaimer & Copyright………………………. 245


[Back to top]

Tables

[Click here for Figures]

5 Volumes:

COVID-19 Pandemic Mitigation Products Market – 2020-2024 – Volume 1

COVID-19 Pandemic Mitigation Products Market – 2020-2024 – Volume 2

COVID-19 Pandemic Mitigation Products Market – 2020-2024 – Volume 3

COVID-19 Pandemic Mitigation Products Market – 2020-2024 – Volume 4

COVID-19 Pandemic Mitigation Products Market – 2020-2024 – Volume 5


COVID-19 Pandemic Mitigation Products Market – 2020-2024 – Volume 1

Table 1 – COVID-19 June 1, 2020 COVID-19 Cases and the Number Dead per Million by Country.. 26

Table 2 – Global Products & Services Groups Markets’ Size [$M]: Scenario A – 2020-2024………. 46

Table 3 – Global Products & Services Groups Markets’ Size [$M]: Scenario B – 2020-2024………. 47

Table 4 – Global Products & Services Markets’ Size [$M]: Scenario A – 2020-2024……………………… 50

Table 5 – Global Products & Services Markets’ Size [$M]: Scenario B – 2020-2024……………………… 52

Table 6 – Global Vertical Markets’ Size [$M]: Scenario A – 2020-2024………………………………………. 54

Table 7 – Global Vertical Markets’ Size [$M]: Scenario B – 2020-2024………………………………………. 54

Table 8 – Global Market Size by Revenue Source [$M] Scenario A – 2020-2024……………………… 55

Table 9 – Global Market Size by Revenue Source [$M] Scenario B – 2020-2024……………………… 55

Table 10 – Regional Markets Size [$M]: Scenario A – 2020-2024………………………………………. 55

Table 11 – Regional Markets Size [$M]: Scenario B – 2020-2024………………………………………. 56

Table 12 – National Markets Size [$M]: Scenario A – 2020-2024………………………………………. 56

Table 13 – National Markets Size [$M]: Scenario B – 2020-2024………………………………………. 57

Table 14 –  COVID-19 Pandemic Mitigation Products Market: Business Opportunities…………… 81

Table 15 – Global Products & Services Groups Markets’ Size [$M]: Scenario A – 2020-2024………. 87

Table 16 – Global Products & Services Groups Markets’ Dynamics [%]: Scenario A – 2020-2024…. 89

Table 17 – Global Products & Services Groups Markets’ Size [$M]: Scenario B – 2020-2024………. 90

Table 18 – Global Products & Services Groups Markets’ Dynamics [%]: Scenario B – 2020-2024…. 91

Table 19 – Global Products & Services Markets’ Size [$M]: Scenario A – 2020-2024……………… 94

Table 20 – Global Products & Services Markets’ Dynamics [%]: Scenario A – 2020-2024…. 96

Table 21 – Global Products & Services Markets’ Size [$M]: Scenario B – 2020-2024……………… 98

Table 22 – Global Products & Services Markets’ Dynamics [%]: Scenario B – 2020-2024.. 101

Table 23 – Global Vertical Markets’ Size [$M]: Scenario A – 2020-2024…………………………………… 104

Table 24 – Global Vertical Markets’ Dynamics [%]: Scenario A – 2020-2024……………………. 105

Table 25 – Global Vertical Markets’ Size [$M]: Scenario B – 2020-2024…………………………………… 106

Table 26 – Global Vertical Markets’ Dynamics [%]: Scenario B – 2020-2024……………………. 106

Table 27 – Global Market Size by Revenue Source [$M] Scenario A – 2020-2024……………………. 108

Table 28 – Global Markets Dynamics by Revenue Source [%]: Scenario A – 2020-2024……………… 108

Table 29 – Global Market Size by Revenue Source [$M] Scenario B – 2020-2024……………………. 109

Table 30 – Global Markets Dynamics by Revenue Source [%]: Scenario B – 2020-2024……………… 110

Table 31 – Regional Markets Size [$M]: Scenario A – 2020-2024……………………………………… 112

Table 32 – Regional Markets Dynamics by Region [%]: Scenario A – 2020-2024……………………. 112

Table 33 – Regional Markets Size [$M]: Scenario B – 2020-2024……………………………………… 113

Table 34 – Regional Markets Dynamics [%]: Scenario B – 2020-2024……………………………………… 114

Table 35 – National Markets Size [$M]: Scenario A – 2020-2024……………………………………… 116

Table 36 – National Markets Dynamics [%]: Scenario A – 2020-2024……………………………………… 118

Table 37 – National Markets Size [$M]: Scenario B – 2020-2024……………………………………… 119

Table 38 – National Markets Dynamics [%]: Scenario B – 2020-2024……………………………………… 121


[Back to top]

COVID-19 Pandemic Mitigation Products Market – 2020-2024 – Volume 2

Table 1 – Adult Vaccine 2020-2021 Price List………….. 48

Table 2 – Adult  Influenza Vaccine 2020-2021 Price List……………………………………………………… 49

Table 3 – Vaccines Market Size, Market Dynamics & Market Share: Scenario A – 2020-2024…. 58

Table 4 – Vaccines Market Size, Market Dynamics & Market Share: Scenario B – 2020-2024…. 59

Table 5 – Therapeutic Drugs Market Size, Market Dynamics & Market Share: Scenario A – 2020-2024………………………………………. 74

Table 6 – Therapeutic Drugs Market Size, Market Dynamics & Market Share: Scenario B – 2020-2024………………………………………. 75

Table 7 – Other Pharma Industry Products Market Size, Market Dynamics & Market Share: Scenario A – 2020-2024………………………………….. 80

Table 8 – Other Pharma Industry Products Market Size, Market Dynamics & Market Share: Scenario B – 2020-2024………………………………….. 80

Table 9 – PCR Instrumentation & Software Market Size, Market Dynamics & Market Share: Scenario A – 2020-2024………………………………….. 97

Table 10 – PCR Instrumentation & Software Market Size, Market Dynamics & Market Share: Scenario B – 2020-2024………………………………….. 97

Table 11 – Robotic PCR Systems & Software Market Size, Market Dynamics & Market Share: Scenario A – 2020-2024……………………. 105

Table 12 – Robotic PCR Systems & Software Market Size, Market Dynamics & Market Share: Scenario B – 2020-2024……………………. 106

Table 13 – PCR Reagents & Consumables Market Size, Market Dynamics & Market Share: Scenario A – 2020-2024………………………………… 111

Table 14 – PCR Reagents & Consumables Market Size, Market Dynamics & Market Share: Scenario B – 2020-2024………………………………… 112

Table 15 – Nose & Mouth Swabs Market Size, Market Dynamics & Market Share: Scenario A – 2020-2024……………………………………… 117

Table 16 – Nose & Mouth Swabs Market Size, Market Dynamics & Market Share: Scenario B – 2020-2024……………………………………… 117

Table 17 – Self-collection PCR Test Kits Market Size, Market Dynamics & Market Share: Scenario A – 2020-2024………………………………… 123

Table 18 – Self-collection PCR Test Kits Market Size, Market Dynamics & Market Share: Scenario B – 2020-2024………………………………… 123

Table 19 – Serologic Test Kits Market Size, Market Dynamics & Market Share: Scenario A – 2020-2024……………………………………… 139

Table 20 – Serologic Test Kits Market Size, Market Dynamics & Market Share: Scenario B – 2020-2024……………………………………… 140

Table 21 – Standoff Thermometry Market Size, Market Dynamics & Market Share: Scenario A – 2020-2024……………………………………… 146

Table 22 – Standoff Thermometry Market Size, Market Dynamics & Market Share: Scenario B – 2020-2024……………………………………… 146

Table 23 – X-Ray Procedures Market Size, Market Dynamics & Market Share: Scenario A – 2020-2024……………………………………… 154

Table 24 – X-Ray Procedures Market Size, Market Dynamics & Market Share: Scenario B – 2020-2024……………………………………… 154

Table 25 – CT Procedures Market Size, Market Dynamics & Market Share: Scenario A – 2020-2024……………………………………………………. 160

Table 26 – CT Procedures Market Size, Market Dynamics & Market Share: Scenario B – 2020-2024……………………………………………………. 160

Table 27 – Ultrasound Procedures Market Size, Market Dynamics & Market Share: Scenario A – 2020-2024……………………………………… 167

Table 28 – Ultrasound Procedures Market Size, Market Dynamics & Market Share: Scenario B – 2020-2024……………………………………… 167

Table 29 – FDG-PET/CT Procedures & Wastewater Testing Market Size, Market Dynamics & Market Share: Scenario A – 2020-2024.. 174

Table 30 – FDG-PET/CT Procedures & Wastewater Testing Market Size, Market Dynamics & Market Share: Scenario B – 2020-2024.. 174

Table 31 – PACS & Teleradiology Market Size, Market Dynamics & Market Share: Scenario A – 2020-2024……………………………………… 183

Table 32 – PACS & Teleradiology Market Size, Market Dynamics & Market Share: Scenario B – 2020-2024……………………………………… 183

Table 33 – PPE Gowns Market Size, Market Dynamics & Market Share: Scenario A – 2020-2024.. 191

Table 34 – PPE Gowns Market Size, Market Dynamics & Market Share: Scenario B – 2020-2024.. 192

Table 35 – Gloves Market Size, Market Dynamics & Market Share: Scenario A – 2020-2024.. 195

Table 36 – Gloves Market Size, Market Dynamics & Market Share: Scenario B – 2020-2024.. 196

Table 37 – Face Masks Market Size, Market Dynamics & Market Share: Scenario A – 2020-2024.. 206

Table 38 – Face Masks Market Size, Market Dynamics & Market Share: Scenario B – 2020-2024.. 206

Table 39 – Medical Face Shields Market Size, Market Dynamics & Market Share: Scenario A – 2020-2024……………………………………… 210

Table 40 – Medical Face Shields Market Size, Market Dynamics & Market Share: Scenario B – 2020-2024……………………………………… 211

Table 41 – Eye Protection Market Size, Market Dynamics & Market Share: Scenario A – 2020-2024……………………………………………………. 214

Table 42 – Eye Protection Market Size, Market Dynamics & Market Share: Scenario B – 2020-2024……………………………………………………. 215

Table 43 – PPE Sterilization: Systems & Consumables Market Size, Market Dynamics & Market Share: Scenario A – 2020-2024………….. 216

Table 44 – PPE Sterilization: Systems & Consumables Market Size, Market Dynamics & Market Share: Scenario B – 2020-2024………….. 217

Table 45 – Hand & Surface Sanitizers Market Size, Market Dynamics & Market Share: Scenario A – 2020-2024………………………………… 221

Table 46 – Hand & Surface Sanitizers Market Size, Market Dynamics & Market Share: Scenario B – 2020-2024………………………………… 222

Table 47 – Decontamination Market Size, Market Dynamics & Market Share: Scenario A – 2020-2024……………………………………… 229

Table 48 – Decontamination Market Size, Market Dynamics & Market Share: Scenario B – 2020-2024……………………………………… 229

Table 49 – Other Personal Protection Gear Market Size, Market Dynamics & Market Share: Scenario A – 2020-2024………………………………… 231

Table 50 – Other Personal Protection Gear Market Size, Market Dynamics & Market Share: Scenario B – 2020-2024………………………………… 232

Table 51 – AI, Big Data & Deep Learning Market Size, Market Dynamics & Market Share: Scenario A – 2020-2024………………………………… 250

Table 52 – AI, Big Data & Deep Learning Market Size, Market Dynamics & Market Share: Scenario B – 2020-2024………………………………… 250

Table 53 – Homecare IT Market Size, Market Dynamics & Market Share: Scenario A – 2020-2024.. 255

Table 54 – Homecare IT Market Size, Market Dynamics & Market Share: Scenario B – 2020-2024.. 255

Table 55 – Use of Pandemic Geo-Location Data by Country…………………………………………. 260

Table 56 – Geo-Surveillance Systems & Services Market Size, Market Dynamics & Market Share: Scenario A – 2020-2024……………………. 271

Table 57 – Geo-Surveillance Systems & Services Market Size, Market Dynamics & Market Share: Scenario B – 2020-2024……………………. 271

Table 58 – E-Health Market Size, Market Dynamics & Market Share: Scenario A – 2020-2024.. 276

Table 59 – E-Health Market Size, Market Dynamics & Market Share: Scenario B – 2020-2024.. 276

Table 60 – Blockchain Technologies Market Size, Market Dynamics & Market Share: Scenario A – 2020-2024……………………………………… 284

Table 61 – Blockchain Technologies Market Size, Market Dynamics & Market Share: Scenario B – 2020-2024……………………………………… 285

Table 62 – Other ICT Market Size, Market Dynamics & Market Share: Scenario A – 2020-2024.. 291

Table 63 – Other ICT Market Size, Market Dynamics & Market Share: Scenario B – 2020-2024.. 291

Table 64 – Procurement Contracts on Non-Invasive Ventilators with Ten Vendors…………….. 299

Table 65 – Noninvasive Ventilators Market Size, Market Dynamics & Market Share: Scenario A – 2020-2024……………………………………… 303

Table 66 – Noninvasive Ventilators Market Size, Market Dynamics & Market Share: Scenario B – 2020-2024……………………………………… 304

Table 67 – Invasive Mechanical Ventilators Market Size, Market Dynamics & Market Share: Scenario A – 2020-2024………………………………… 316

Table 68 – Invasive Mechanical Ventilators Market Size, Market Dynamics & Market Share: Scenario B – 2020-2024………………………………… 317

Table 69 – Next Generation Ventilators Market Size, Market Dynamics & Market Share: Scenario A – 2020-2024………………………………… 322

Table 70 – Next Generation Ventilators Market Size, Market Dynamics & Market Share: Scenario B – 2020-2024………………………………… 322

Table 71 – Homecare “ICU”  (Equipment, Software, Services) Market Size, Market Dynamics & Market Share: Scenario A – 2020-2024.. 332

Table 72 – Homecare “ICU”  (Equipment, Software, Services) Market Size, Market Dynamics & Market Share: Scenario B – 2020-2024.. 332

Table 73 – Mobile Ventilators Market Size, Market Dynamics & Market Share: Scenario A – 2020-2024……………………………………… 337

Table 74 – Mobile Ventilators Market Size, Market Dynamics & Market Share: Scenario B – 2020-2024……………………………………… 338

Table 75 – Surge Capacity Hospitals Market Size, Market Dynamics & Market Share: Scenario A – 2020-2024……………………………………… 342

Table 76 – Surge Capacity Hospitals Market Size, Market Dynamics & Market Share: Scenario B – 2020-2024……………………………………… 343

Table 77 – Kidney Dialysis Market Size, Market Dynamics & Market Share: Scenario A – 2020-2024……………………………………………………. 348

Table 78 – Kidney Dialysis Market Size, Market Dynamics & Market Share: Scenario B – 2020-2024……………………………………………………. 349

Table 79 – Extracorporeal Membrane Oxygenation Procedures Market Size, Market Dynamics & Market Share: Scenario A – 2020-2024……………………………………………………. 356

Table 80 – Extracorporeal Membrane Oxygenation Procedures Market Size, Market Dynamics & Market Share: Scenario B – 2020-2024……………………………………………………. 356

Table 81 – Other Intensive Care Modalities Market Size, Market Dynamics & Market Share: Scenario A – 2020-2024………………………………… 362

Table 82 – Other Intensive Care Modalities Market Size, Market Dynamics & Market Share: Scenario B – 2020-2024………………………………… 362

Table 83 – Gowns Manufacturing Plants Market Size, Market Dynamics & Market Share: Scenario A – 2020-2024………………………………… 367

Table 84 – Gowns Manufacturing Plants Market Size, Market Dynamics & Market Share: Scenario B – 2020-2024………………………………… 367

Table 85 – Gloves Manufacturing Plants Market Size, Market Dynamics & Market Share: Scenario A – 2020-2024………………………………… 373

Table 86 – Gloves Manufacturing Plants Market Size, Market Dynamics & Market Share: Scenario B – 2020-2024………………………………… 373

Table 87 – Face Masks Manufacturing Plants Market Size, Market Dynamics & Market Share: Scenario A – 2020-2024……………………. 387

Table 88 – Face Masks Manufacturing Plants Market Size, Market Dynamics & Market Share: Scenario B – 2020-2024……………………. 387

Table 89 – Face Shields Manufacturing Plants Market Size, Market Dynamics & Market Share: Scenario A – 2020-2024……………………. 391

Table 90 – Face Shields Manufacturing Plants Market Size, Market Dynamics & Market Share: Scenario B – 2020-2024……………………. 392

Table 91 – Serologic Test Kits Manufacturing Plants Market Size, Market Dynamics & Market Share: Scenario A – 2020-2024………….. 395

Table 92 – Serologic Test Kits Manufacturing Plants Market Size, Market Dynamics & Market Share: Scenario B – 2020-2024………….. 395

Table 93 – Melt-Blown PPE Fabric Manufacturing Plants Market Size, Market Dynamics & Market Share: Scenario A – 2020-2024………….. 403

Table 94 – Melt-Blown PPE Fabric Manufacturing Plants Market Size, Market Dynamics & Market Share: Scenario B – 2020-2024………….. 403

Table 95 – Spun-Bond PPE Fabric Manufacturing Plants Market Size, Market Dynamics & Market Share: Scenario A – 2020-2024………….. 408

Table 96 – Spun-Bond PPE Fabric Manufacturing Plants Market Size, Market Dynamics & Market Share: Scenario B – 2020-2024………….. 408

Table 97 – Self-collection PCR Test Kits Manufacturing Plants Market Size, Market Dynamics & Market Share: Scenario A – 2020-2024.. 411

Table 98 – Self-collection PCR Test Kits Manufacturing Plants Market Size, Market Dynamics & Market Share: Scenario B – 2020-2024.. 412

Table 99 – Ventilators Manufacturing Plants Market Size, Market Dynamics & Market Share: Scenario A – 2020-2024………………………………… 418

Table 100 – Ventilators Manufacturing Plants Market Size, Market Dynamics & Market Share: Scenario B – 2020-2024……………………. 418

Table 101 – PCR Reagents Manufacturing Plants Market Size, Market Dynamics & Market Share: Scenario A – 2020-2024……………………. 419

Table 102 – PCR Reagents Manufacturing Plants Market Size, Market Dynamics & Market Share: Scenario B – 2020-2024……………………. 420

Table 103 – PCR Systems Manufacturing Plants Market Size, Market Dynamics & Market Share: Scenario A – 2020-2024……………………. 421

Table 104 – PCR Systems Manufacturing Plants Market Size, Market Dynamics & Market Share: Scenario B – 2020-2024……………………. 422

Table 105 – Nose & Mouth Swabs Manufacturing Plants Market Size, Market Dynamics & Market Share: Scenario A – 2020-2024………….. 427

Table 106 – Nose & Mouth Swabs Manufacturing Plants Market Size, Market Dynamics & Market Share: Scenario B – 2020-2024………….. 427

Table 107 – Medical Glass & Other Manufacturing Plants Market Size, Market Dynamics & Market Share: Scenario A – 2020-2024………….. 428

Table 108 – Medical Glass & Other Manufacturing Plants Market Size, Market Dynamics & Market Share: Scenario B – 2020-2024………….. 429

Table 109 – R&D Equipment & Consumables Market Size, Market Dynamics & Market Share: Scenario A – 2020-2024……………………. 430

Table 110 – R&D Equipment & Consumables Market Size, Market Dynamics & Market Share: Scenario B – 2020-2024……………………. 431

Table 111 – Medical Glass and Other Products & Services Market Size, Market Dynamics & Market Share: Scenario A – 2020-2024.. 434

Table 112 – Medical Glass and Other Products & Services Market Size, Market Dynamics & Market Share: Scenario B – 2020-2024.. 434


[Back to top]

COVID-19 Pandemic Mitigation Products Market – 2020-2024 – Volume 3

Table 1 – Hospitals and Surge Hospitals Market Size by Region [$M]: Scenario A – 2020-2024…… 15

Table 2 – Hospitals and Surge Hospitals Market Dynamics by Region [%]: Scenario A – 2020-2024………………………………………. 15

Table 3 – Hospitals and Surge Hospitals Market Size by Region [$M]: Scenario B – 2020-2024…… 16

Table 4 – Hospitals and Surge Hospitals Market Dynamics by Region [%]: Scenario B – 2020-2024………………………………………. 17

Table 5 – Clinical Labs Market Size by Region [$M]: Scenario A – 2020-2024……………………… 20

Table 6 – Clinical Labs Market Dynamics by Region [%]: Scenario A – 2020-2024……………………… 20

Table 7 – Clinical Labs Market Size by Region [$M]: Scenario B – 2020-2024……………………… 21

Table 8 – Clinical Labs Market Dynamics by Region [%]: Scenario B – 2020-2024……………………… 22

Table 9 – Clinics Market Size by Region [$M]: Scenario A – 2020-2024…………………………………….. 25

Table 10 – Clinics Market Dynamics by Region [%]: Scenario A – 2020-2024……………………… 25

Table 11 – Clinics Market Size by Region [$M]: Scenario B – 2020-2024………………………………….. 26

Table 12 – Clinics Market Dynamics by Region [%]: Scenario B – 2020-2024……………………… 27

Table 13 – Emergency Medical Services (EMS) Market Size by Region [$M]: Scenario A – 2020-2024………………………………………………. 30

Table 14 – Emergency Medical Services (EMS) Market Dynamics by Region [%]: Scenario A – 2020-2024………………………………………. 30

Table 15 – Emergency Medical Services (EMS) Market Size by Region [$M]: Scenario B – 2020-2024………………………………………………. 31

Table 16 – Emergency Medical Services (EMS) Market Dynamics by Region [%]: Scenario B – 2020-2024………………………………………. 32

Table 17 – Homecare & Nursing Homes Market Size by Region [$M]: Scenario A – 2020-2024…… 35

Table 18 – Homecare & Nursing Homes Market Dynamics by Region [%]: Scenario A – 2020-2024… 35

Table 19 – Homecare & Nursing Homes Market Size by Region [$M]: Scenario B – 2020-2024…… 36

Table 20 – Homecare & Nursing Homes Market Dynamics by Region [%]: Scenario B – 2020-2024… 37

Table 21 – Research Bodies Market Size by Region [$M]: Scenario A – 2020-2024……………………… 40

Table 22 – Research Bodies Market Dynamics by Region [%]: Scenario A – 2020-2024……………….. 40

Table 23 – Research Bodies Market Size by Region [$M]: Scenario B – 2020-2024……………………… 41

Table 24 – Research Bodies Market Dynamics by Region [%]: Scenario B – 2020-2024……………….. 42

Table 25 – North America Vertical Markets’ Size [$M]: Scenario A – 2020-2024……………………… 45

Table 26 – North America Vertical Markets’ Dynamics [%]: Scenario A – 2020-2024……………………… 45

Table 27 – North America Vertical Markets’ Size [$M]: Scenario B – 2020-2024……………………… 46

Table 28 – North America Vertical Markets’ Dynamics [%]: Scenario B – 2020-2024……………………… 47

Table 29 – North America Market Size by Revenue Source [$M] Scenario A – 2020-2024……. 49

Table 30 – North America Markets Dynamics by Revenue Source [%]: Scenario A – 2020-2024…….. 50

Table 31 – North America Market Size by Revenue Source [$M] Scenario B – 2020-2024……. 51

Table 32 – North America Markets Dynamics by Revenue Source [%]: Scenario B – 2020-2024…….. 52

Table 33 – Europe Vertical Markets’ Size [$M]: Scenario A – 2020-2024…………………………………….. 54

Table 34 – Europe Vertical Markets’ Dynamics [%]: Scenario A – 2020-2024……………………… 54

Table 35 – Europe Vertical Markets’ Size [$M]: Scenario B – 2020-2024…………………………………….. 55

Table 36 – Europe Vertical Markets’ Dynamics [%]: Scenario B – 2020-2024……………………… 56

Table 37 – Europe Market Size by Revenue Source [$M] Scenario A – 2020-2024……………………… 58

Table 38 – Europe Markets Dynamics by Revenue Source [%]: Scenario A – 2020-2024……………….. 59

Table 39 – Europe Market Size by Revenue Source [$M] Scenario B – 2020-2024……………………… 60

Table 40 – Europe Markets Dynamics by Revenue Source [%]: Scenario B – 2020-2024……………….. 60

Table 41 – Asia-Pacific Vertical Markets’ Size [$M]: Scenario A – 2020-2024……………………… 61

Table 42 – Asia-Pacific Vertical Markets’ Dynamics [%]: Scenario A – 2020-2024……………………… 62

Table 43 – Asia-Pacific Vertical Markets’ Size [$M]: Scenario B – 2020-2024……………………… 63

Table 44 – Asia-Pacific Vertical Markets’ Dynamics [%]: Scenario B – 2020-2024……………………… 63

Table 45 – Asia-Pacific Market Size by Revenue Source [$M] Scenario A – 2020-2024………………. 65

Table 46 – Asia-Pacific Markets Dynamics by Revenue Source [%]: Scenario A – 2020-2024…….. 66

Table 47 – Asia-Pacific Market Size by Revenue Source [$M] Scenario B – 2020-2024………………. 67

Table 48 – Asia-Pacific Markets Dynamics by Revenue Source [%]: Scenario B – 2020-2024…….. 68

Table 49 – MEA & Latin America Vertical Markets’ Size [$M]: Scenario A – 2020-2024……………… 70

Table 50 – MEA & Latin America Vertical Markets’ Dynamics [%]: Scenario A – 2020-2024…. 70

Table 51 – MEA & Latin America Vertical Markets’ Size [$M]: Scenario B – 2020-2024……………… 71

Table 52 – MEA & Latin America Vertical Markets’ Dynamics [%]: Scenario B – 2020-2024…. 72

Table 53 – MEA & Latin America Market Size by Revenue Source [$M] Scenario A – 2020-2024……. 74

Table 54 – MEA & Latin America Markets Dynamics by Revenue Source [%]: Scenario A – 2020-2024………………………………………………. 75

Table 55 – MEA & Latin America Market Size by Revenue Source [$M] Scenario B – 2020-2024……. 76

Table 56 – MEA & Latin America Markets Dynamics by Revenue Source [%]: Scenario B – 2020-2024………………………………………………. 77

Table 57 – USA Market Size, Dynamics and Share: Scenario A – 2020-2024……………………… 79

Table 58 – USA Market Size, Dynamics and Share: Scenario B – 2020-2024……………………… 80

Table 59 – Canada Market Size, Dynamics and Share: Scenario A – 2020-2024……………………… 83

Table 60 – Canada Market Size, Dynamics and Share: Scenario B – 2020-2024……………………… 83

Table 61 – U.K. Market Size, Dynamics and Share: Scenario A – 2020-2024……………………… 86

Table 62 – U.K. Market Size, Dynamics and Share: Scenario B – 2020-2024……………………… 86

Table 63 – Germany Market Size, Dynamics and Share: Scenario A – 2020-2024……………………… 89

Table 64 – Germany Market Size, Dynamics and Share: Scenario B – 2020-2024……………………… 89

Table 65 – France Market Size, Dynamics and Share: Scenario A – 2020-2024……………………… 92

Table 66 – France Market Size, Dynamics and Share: Scenario B – 2020-2024……………………… 92

Table 67 – Italy Market Size, Dynamics and Share: Scenario A – 2020-2024……………………… 95

Table 68 – Italy Market Size, Dynamics and Share: Scenario B – 2020-2024……………………… 95

Table 69 – Rest of Europe Market Size, Dynamics and Share: Scenario A – 2020-2024…………… 96

Table 70 – Rest of Europe Market Size, Dynamics and Share: Scenario B – 2020-2024…………… 96

Table 71 – India Market Size, Dynamics and Share: Scenario A – 2020-2024……………………. 100

Table 72 – India Market Size, Dynamics and Share: Scenario B – 2020-2024……………………. 100

Table 73 – China Market Size, Dynamics and Share: Scenario A – 2020-2024……………………. 103

Table 74 – China Market Size, Dynamics and Share: Scenario B – 2020-2024……………………. 103

Table 75 – South Korea Market Size, Dynamics and Share: Scenario A – 2020-2024………….. 105

Table 76 – South Korea Market Size, Dynamics and Share: Scenario B – 2020-2024………….. 106

Table 77 – Japan Market Size, Dynamics and Share: Scenario A – 2020-2024……………………. 109

Table 78 – Japan Market Size, Dynamics and Share: Scenario B – 2020-2024……………………. 109

Table 79 – Rest of Asia-Pacific Market Size, Dynamics and Share: Scenario A – 2020-2024……. 110

Table 80 – Rest of Asia-Pacific Market Size, Dynamics and Share: Scenario B – 2020-2024……. 110

Table 81 – ROW Market Size, Dynamics and Share: Scenario A – 2020-2024……………………. 112

Table 82 – ROW Market Size, Dynamics and Share: Scenario B – 2020-2024……………………. 112


[Back to top]

COVID-19 Pandemic Mitigation Products Market – 2020-2024 – Volume 4

This Volume contains no tables.


[Back to top]

COVID-19 Pandemic Mitigation Products Market – 2020-2024 – Volume 5

Table 1 – Summary of Findings for the Main Comparison. PPE‐Types: One Type of PPE versus Another – PAPR versus E-RCP Attire………………………………………………. 15

Table 2 – Summary of Findings 2. PPE Types: One Type of PPE versus Another – Three Types of PPE Attire……………………………………….. 15

Table 3 – Summary of Findings 3. PPE Types: One Type of PPE versus Another – Gowns versus Aprons……………………………………………. 16

Table 4 – Summary of Findings 5. PPE Types: One Type of PPE versus Another ‐ Sealed Suit Compared To Traditional Suit……………… 16

Table 5 – Summary of Findings 6. Procedures: Doffing With Double Gloves versus Doffing With Single Gloves…………………………………… 17

Table 6 – Summary of Findings 8. Procedures: Mask Tabs versus No Mask Tabs………………… 17

Table 7 – Summary of Findings 9. Procedures: Doffing According To CDC Method versus Individual Doffing……………………………………………. 17

Table 8 – Summary of Findings 10. Procedures: Doffing With Hypochlorite versus Doffing With Alcohol‐Based Glove Sanitizer……………. 18

Table 9 – Summary of Findings 11. Procedures: Doffing With Chlorine Spray versus Doffing Without Spray……………………………………………… 18

Table 10 – Summary of Findings 12. Teaching: Video‐Based Learning versus Traditional Lecture……………………………………………………… 18

Table 11 – CDC Vaccine 2020-2021 Price List………….. 43

Table 12 – CDC Influenza Vaccine 2020-2021 Price List……………………………………………………… 44

Table 13 – The OECD Global Economic Outlook Forecast, 2019-2021…………………………. 92


[Back to top]

Figures

5 Volumes:

COVID-19 Pandemic Mitigation Products Market – 2020-2024 – Volume 1

COVID-19 Pandemic Mitigation Products Market – 2020-2024 – Volume 2

COVID-19 Pandemic Mitigation Products Market – 2020-2024 – Volume 3

COVID-19 Pandemic Mitigation Products Market – 2020-2024 – Volume 4

COVID-19 Pandemic Mitigation Products Market- 2020-2024 – Volume 5


[Back to top]

COVID-19 Pandemic Mitigation Products Market – Volume 1

Figure 1 – Mortality Rate Comparison, MERS, SARS & COVID-19……………………………………….. 11

Figure 2 – COVID-19 Vs. Other Pandemics: Ro & Fatality Rate……………………………………………….. 13

Figure 3 – The Effect of the PRC Draconic Social Distancing Policy………………………………. 13

Figure 4 – Healthcare Expenditure [$B] by County – 2019……………………………………………………… 14

Figure 5 – Lower and Delay the Pandemic Peak Strategy……………………………………………………… 20

Figure 6 – The 10 Countries with the Most Foreign Drug Establishments Shipping to the United States as of 2019, by Country……………… 21

Figure 7 – Number of (2019) Intensive Care Beds [000] by Country…………………………………………… 22

Figure 8 – ICU Beds (2019) Per 100,000 Inhabitants, by Country…………………………………………… 23

Figure 9 – The WHO Research Funding ($8.5 Billion) Allocation………………………………………… 28

Figure 10 – A Serologic Test Kit…………………………….. 35

Figure 11 – Modeling COVID-19 Pandemic: ‘Uncertainty is the Only Certainty’…………………………. 37

Figure 12 – The Way an Application Detects a Person w/o Symptoms……………………………………….. 38

Figure 13 – Countries Enacting Geo-Surveillance Services to Mitigate the COVID-19 Pandemic………………………………………… 39

Figure 14  – COVID-19 Pandemic Impact on Global Economics & Geopolitics……………………. 41

Figure 15 – Global COVID-19 Pandemic Mitigation Products Market Vectors……………………. 45

Figure 16 – Global Products & Services Groups Markets’ Size [$M]: Scenario A – 2020-2024………. 47

Figure 17 – Global Products & Services Groups Markets’ Size [$M]: Scenario B – 2020-2024………. 48

Figure 18 – Global Products & Services Markets’ Size [$M]: Scenarios A and B – 2020-2024…… 49

Figure 19 – The SARS‑CoV‑2 Virus………………………… 58

Figure 20 – Epidemics &  Pandemics Historical Timeline……………………………………………………… 60

Figure 21 – COVID-19 Ro & Fatality Rate Vs. Other Pandemics Ro & Fatality Rate…………….. 62

Figure 22 – How Herd Immunity Can Stop the COVID-19……………………………………………………… 63

Figure 23 – The Effect of an Pandemic Early Stage Using “Social Distancing” Measures……………… 63

Figure 24 – The SARS‑CoV‑2, Size, Content, Genome and Replication Timescales………………… 64

Figure 25 – Serology Test Process…………………………. 72

Figure 26:  COVID-19 Pandemic Mitigation Products Industry Value Chain…………………………. 83

Figure 27 – COVID-19 Pandemic Mitigation Products Security Systems Market Competitive Analysis………………………………………….. 86

Figure 28 – Global Products & Services Groups Markets’ Size [$M]: Scenario A – 2020-2024………. 88

Figure 29 – Global Products & Services Groups Market Shares [%]: Scenario A – 2020-2024…….. 89

Figure 30 – Global Products & Services Groups Markets’ Size [$M]: Scenario B – 2020-2024………. 91

Figure 31 – Global Products & Services Groups Market Shares [%]: Scenario B – 2020-2024…….. 92

Figure 32 – Global COVID-19 Mitigation Market Size [$M]: Scenarios A and B – 2020-2024…………… 92

Figure 33 – Global Products & Services Markets’ Size [$M]: Scenarios A and B – 2020-2024…. 103

Figure 34 – Global Vertical Markets’ Shares [%]: Scenario A – 2020-2024………………………………… 105

Figure 35 – Global Vertical Markets’ Shares [%]: Scenario B – 2020-2024………………………………… 107

Figure 36 – Global Vertical Markets’ Size [$M]: Scenarios A and B – 2020-2024……………………….. 107

Figure 37 – Global Market Shares by Revenue Source [%]: Scenario A – 2020-2024…………………. 109

Figure 38 – Global Market Shares by Revenue Source [%]: Scenario B – 2020-2024…………………. 110

Figure 39 – Global Revenue Sources [$M]: Scenarios A and B – 2020-2024…………………………… 111

Figure 40 – Regional Market Shares [%]: Scenario A – 2020-2024……………………………………… 113

Figure 41 – Regional Market Shares [%]: Scenario B – 2020-2024……………………………………… 114

Figure 42 – Regional Markets’ Size [$M]: Scenarios A and B – 2020-2024………………………………… 115

Figure 43 – National Markets Size [$M]: Scenario A – 2020-2024……………………………………… 117

Figure 44 – National Markets Shares [%]: Scenario A – 2020-2024……………………………………… 118

Figure 45 – National Markets Size [$M]: Scenario B – 2020-2024……………………………………… 120

Figure 46 – National Markets Shares [%]: Scenario B – 2020-2024……………………………………… 122

Figure 47 – COVID-19 National Markets Size [$M]: Scenarios A and B – 2020-2024…………. 122


[Back to top]

COVID-19 Pandemic Mitigation Products Market – 2020-2024 – Volume 2

Figure 1 – Vaccine Development: Traditional Timeline vs. COVID-19 Accelerated Timeline………….. 34

Figure 2 – COVID-19 Vaccines Market: Barriers to Entry, Supplier Power, Buyer Power and Substitution……………………………………… 54

Figure 3 – Vaccines Market Size [$M] by Scenario – 2020-2024………………………………………………. 59

Figure 4 – FDA Testing COVID-19 Treatment…………… 62

Figure 5 – Network-Based Drug Repurposing For COVID-19………………………………………………….. 64

Figure 6 – COVID-19 Therapeutic Drug Market: Barriers to Entry, Supplier Power, Buyer Power and Substitution……………………………………… 70

Figure 7 – COVID-19 Therapeutic Drugs Market Size [$M] by Scenario – 2020-2024……………………. 75

Figure 8- Medicines Essential for ICU Care of COVID-19 Patients Are Prepped For Shipment in Direct Relief’s Warehouse………………….. 76

Figure 9 – Other COVID-19 Pharma Industry Products Market: Barriers to Entry, Supplier Power, Buyer Power and Substitution……………… 79

Figure 10 – Other Pharma Industry Products Market Size [$M] by Scenario – 2020-2024……………… 81

Figure 11 – Reverse Transcription – Polymerase Chain Reaction (RT-PCR) Process……………….. 83

Figure 12- PCR Test……………………………………………. 84

Figure 13 – PCR Thermal Amplification…………………… 85

Figure 14 – Antibody Vs. PCR Testing Methods………… 87

Figure 15 – RT-PCR Process………………………………… 89

Figure 16 – COVID-19 PCR Components………………… 91

Figure 17 – PCR Instrumentation & Software Market: Barriers to Entry, Supplier Power, Buyer Power and Barriers to Substitution……….. 95

Figure 18 – PCR Instrumentation & Software Market Size [$M] by Scenario – 2020-2024……………… 97

Figure 19 – Robotic COVID-19 PCR Lab Can Process 1000 Patient Samples Daily………………. 100

Figure 20 – A Robotic PCR Lab Can Provide Much Needed Testing Capacity For Those With Symptoms Consistent With COVID-19 Infection………………………………………… 101

Figure 21 – Thermo Fisher Robotic Based Lab Automation…………………………………….. 101

Figure 22 – Robotic PCR Systems & Software Market: Barriers to Entry, Supplier Power, Buyer Power and Substitution…………………….. 104

Figure 23 – Robotic PCR Systems & Software Market Size [$M] by Scenario – 2020-2024…….. 106

Figure 24 – COVID-19 PCR Kit…………………………….. 107

Figure 25 – PCR Reagents & Consumables Market: Barriers to Entry, Supplier Power, Buyer Power and Substitution…………………….. 110

Figure 26 – PCR Reagents & Consumables Market Size [$M] by Scenario – 2020-2024……………. 112

Figure 27 – Nose & Mouth Swabs Collecting Procedure……………………………………………………. 113

Figure 28 – PCR Sample Using Nose & Mouth Swabs 114

Figure 29 – Nose & Mouth Swabs Market: Barriers to Entry, Supplier Power, Buyer Power and Substitution……………………………………. 116

Figure 30 – Nose & Mouth Swabs Market Size [$M] by Scenario – 2020-2024………………………. 118

Figure 31 – An Oral Self-Swab Kit…………………………. 119

Figure 32 – Saliva Test Vials……………………………….. 121

Figure 33 – FDA Approved Saliva Test………………….. 122

Figure 34 – Self-collection PCR Test Kits Market Size [$M] by Scenario – 2020-2024……………. 123

Figure 35 – A Serologic Test Kit……………………………. 124

Figure 36 – How a Serologic Test Works……………….. 125

Figure 37 – Antibody Vs. PCR Testing Methods………. 128

Figure 38 – The Indian Government’s Proposed COVID-19 Antibody Screening Flowchart……….. 129

Figure 39 – Coronavirus Antibody Test Kit……………… 131

Figure 40 – Coronavirus IgG Antibody Detection Kit Reading………………………………………… 131

Figure 41 – Serologic Test Kits Market: Barriers to Entry, Supplier Power, Buyer Power and Substitution……………………………………. 138

Figure 42 – Serologic Test Kits Market Size [$M] by Scenario – 2020-2024………………………. 140

Figure 43 – COVID-19 Standoff Thermometry Screening……………………………………………………. 141

Figure 44 – Body Temperature Measuring & Facial Recognition Access Control………………. 142

Figure 45 – A Standoff Thermal Camera………………… 143

Figure 46 – A Standoff Thermometer Kit………………… 144

Figure 47 – Standoff Thermometry Market Size [$M] by Scenario – 2020-2024………………………. 146

Figure 48 – A Mobile X-Ray System……………………… 148

Figure 49 – A Series of Chest X-Ray Findings of Patient With COVID-19 Demonstrating Clinical Characteristics of Disease………………… 149

Figure 50 – Partial Filling of Air Spaces in The Lungs From Coronavirus……………………………. 150

Figure 51 – X-Ray Procedures Market Size [$M] by Scenario – 2020-2024………………………. 154

Figure 52 – The Vatech COVID-19 Dedicated CT System……………………………………………………. 155

Figure 53 – Chest CT images of A COVID-19 Patient. Top Five Days after Onset, Bottom 15 Days after Onset……………………………………………. 156

Figure 54 – CT Procedures Market Size [$M] by Scenario – 2020-2024…………………………………… 161

Figure 55 – A Chest Ultrasound Procedure…………….. 162

Figure 56 – CT and Ultrasound Scans from Two COVID-19 Patients…………………………………….. 163

Figure 57 – Ultrasound Procedures Market Size [$M] by Scenario – 2020-2024………………………. 168

Figure 58 – Peripheral GGOs with An Increased 18F-FDG Uptake In The Right Upper Lung And Left Lower Lung……………………………………. 169

Figure 59 – A PET-CT System……………………………… 171

Figure 60 – FDG-PET/CT Procedures & Wastewater Testing Market Size [$M] by Scenario – 2020-2024……………………………………… 175

Figure 61- A PACS Based Infrastructure Linked to RIS, Viewing Stations HIS and Teleradiology Optimizes the Workflow……………………. 177

Figure 62 – PACS Distributed Architecture……………… 178

Figure 63 – A Tablet Linked via Teleradiography to a COVID-19 Patient PACS Record……….. 181

Figure 64 – PACS & Teleradiology Market Size [$M] by Scenario – 2020-2024………………………. 183

Figure 65 – A PPE Set……………………………………….. 185

Figure 66 – Reusable ICU Gowns…………………………. 187

Figure 67 – PPE Gowns Market Size [$M] by Scenario – 2020-2024……………………………………… 192

Figure 68 -Medical Gloves………………………………….. 193

Figure 69 – Gloves Market Size [$M] by Scenario – 2020-2024…………………………………………….. 196

Figure 70 – Face Masks Compared………………………. 197

Figure 71 – When to Use a Respirator or a Surgical Mask……………………………………………………. 199

Figure 72 – N95 Respirator Layers……………………….. 200

Figure 73 – Face Masks Market Size [$M] by Scenario – 2020-2024……………………………………… 206

Figure 74 – Face Shields…………………………………….. 207

Figure 75 – Five Protective Shields Designs…………… 208

Figure 76 – Medical Face Shields Market Size [$M] by Scenario – 2020-2024………………………. 211

Figure 77 – Eye Protection Market Size [$M] by Scenario – 2020-2024……………………………………… 215

Figure 78 – PPE Sterilization: Systems & Consumables Market Size [$M] by Scenario – 2020-2024……………………………………………………. 217

Figure 79 – Hand & Surface Sanitizers Market Size [$M] by Scenario – 2020-2024………………….. 222

Figure 80 – Decontamination Market Size [$M] by Scenario – 2020-2024………………………. 230

Figure 81 – Other Personal Protection Gear Market Size [$M] by Scenario – 2020-2024……………. 232

Figure 82 – A COVID-19 CT Image……………………….. 242

Figure 83 – Signs of Pneumonia in a Chest X-ray……. 244

Figure 84 – COVID-19 AI, Big Data & Deep Learning Flow Diagram………………………………………… 245

Figure 85 – Receiver Operating Characteristic Curves of the Model………………………………………. 245

Figure 86 – Example of a COVID-19 Detection Neural Network………………………………………… 246

Figure 87 – AI, Big Data & Deep Learning Market Size [$M] by Scenario – 2020-2024……………. 251

Figure 88 – Homecare IT Flowchart………………………. 252

Figure 89 – Homecare IT Market Size [$M] by Scenario – 2020-2024……………………………………… 256

Figure 90 – Urban Pandemic Geo-Location System…. 259

Figure 91 – Countries Enacting Geo-Surveillance Services to Mitigate the COVID-19 Pandemic by March 2020…………………. 260

Figure 92 – Cellphone Displays the Private Kit APP…. 264

Figure 93 – Pandemic Geo-Location System without Cell Phones…………………………………………. 265

Figure 94 – The UK NHS COVID-19 Bluetooth App….. 266

Figure 95 – Hong Cong, S. Korea & Singapore who Used a COVID-19 Pandemic Geo-Surveillance Services Prove the Limited Spread of The COVID-19 Vs. Other Countries………….. 269

Figure 96 – Face Recognition as Used in China to Augment its Pandemic Geo-Location System………………………………………….. 270

Figure 97 – Geo-Surveillance Systems & Services Market Size [$M] by Scenario – 2020-2024…….. 271

Figure 98 – E-Health Market Size [$M] by Scenario – 2020-2024……………………………………… 276

Figure 99 – Blockchain Technologies Market Size [$M] by Scenario – 2020-2024………………………. 285

Figure 100 – Other ICT Market Size [$M] by Scenario – 2020-2024……………………………………… 292

Figure 101 – Non-Invasive Ventilator Demonstration… 294

Figure 102 – Mechanical Ventilator vs. Non-Invasive Ventilator………………………………………. 296

Figure 103 – Helmet-Based Non-Invasive Ventilator… 300

Figure 104 – Non-Invasive Ventilators Market: Barriers To Entry, Supplier Power, Buyer Power And Barriers To Substitution……………………. 302

Figure 105 – Noninvasive Ventilators Market Size [$M] by Scenario – 2020-2024………………………. 304

Figure 106 – A Mechanical Invasive Ventilator………… 305

Figure 107 – General Motors / Ventec, VOCSN Multi-function Ventilators Manufactured During April 2020………………………………………. 307

Figure 108 – A Mechanical Ventilator Function………… 309

Figure 109 – System Components Layout & Function. 311

Figure 110 – Invasive Mechanical Ventilators Market: Barriers To Entry, Supplier Power, Buyer Power And Barriers To Substitution……. 315

Figure 111 – Invasive Mechanical Ventilators Market Size [$M] by Scenario – 2020-2024……………. 317

Figure 112 – Next Generation Ventilators Market: Barriers To Entry, Supplier Power, Buyer Power And Barriers To Substitution……………………. 321

Figure 113 – Next Generation Ventilators Market Size [$M] by Scenario – 2020-2024……………. 323

Figure 114 – COVID-19 Homecare Elements………….. 325

Figure 115 – Homecare “ICU” Market: Barriers To Entry, Supplier Power, Buyer Power And Barriers To Substitution……………………………….. 330

Figure 116 – Homecare “ICU”  (Equipment, Software, Services) Market Size [$M] by Scenario – 2020-2024……………………………………… 332

Figure 117 – A Smiths Group Portable Ventilator…….. 333

Figure 118 – An Invasive Portable Ventilator…………… 334

Figure 119 – Mobile Ventilators Market Size [$M] by Scenario – 2020-2024………………………. 338

Figure 120 – Italian Red Cross Surge Hospital Unit Installed During The Fiera Di San Rocco Pandemic………………………………………. 340

Figure 121 – 52 Bed Surge Hospital……………………… 340

Figure 122 – A Russian Tented Surge Hospital……….. 341

Figure 126 – Surge Capacity Hospitals Market Size [$M] by Scenario – 2020-2024………………….. 343

Figure 127 – Kidney Dialysis Market Size [$M] by Scenario – 2020-2024………………………. 349

Figure 128 – ECMO System………………………………… 350

Figure 129 – ECMO Machine Function………………….. 351

Figure 130 – Extracorporeal Oxygenation System Used for a COVID-19 Patient…………………….. 352

Figure 131 – Extracorporeal Membrane Oxygenation Procedures Market Size [$M] by Scenario – 2020-2024……………………………………… 357

Figure 132 – Typical COVID-19 ICU Equipment………. 358

Figure 133 – Other Intensive Care Modalities Market Size [$M] by Scenario – 2020-2024……………. 363

Figure 134 – Ford Manufactures Hospital Gowns with Airbag Material……………………………….. 364

Figure 135 – A Canadian (Canada Goose) PPE Gowns Production Line………………………………. 365

Figure 136 – Gowns Manufacturing Plants Market Size [$M] by Scenario – 2020-2024……………. 368

Figure 137 – Medical gloves coating machine…………. 370

Figure 138 – Medical PPE Gloves Manufacturing Machine………………………………………… 370

Figure 139 – Medical PPE Gloves Manufacturing Line 371

Figure 140 – Gloves Manufacturing Plants Market Size [$M] by Scenario – 2020-2024……………. 374

Figure 141 – A Production Line for the Manufacture Of Masks at a Factory in Shanghai…………. 376

Figure 142 – Automatic Face Mask Making Machine… 378

Figure 143 – N95 Face Mask……………………………….. 379

Figure 144 – A Garment Production Line Converted To Manufacture Face Masks…………………. 383

Figure 145 – An N95 Respirator Manufacturing Line… 384

Figure 146 – Automatic N95 Respirator Face Mask Forming Production Machine…………….. 385

Figure 147 – Face Masks Manufacturing Plants Market Size [$M] by Scenario – 2020-2024…….. 388

Figure 148 – Face Shields Manufacturing Line………… 389

Figure 149 – President Trump Visits a New Face Shield Manufacturing Line………………………….. 390

Figure 150 – Face Shields Manufacturing Plants Market Size [$M] by Scenario – 2020-2024…….. 392

Figure 151 – Test Kits Manufacturing…………………….. 393

Figure 152 – Test Kits Assembly Line……………………. 394

Figure 153 – Serologic Test Kits Manufacturing Plants Market Size [$M] by Scenario – 2020-2024……………………………………………………. 396

Figure 154 – Medical Grade Gown Made Of Melt-Blown Fabric…………………………………………… 398

Figure 155 – Melt-Blown PPE Fabric Manufacturing Machine………………………………………… 399

Figure 156 – Production Lines: Three Spun-Bonded Lines, One Melt-Blown Non-Woven Line and Three Lamination Lines, Producing Melt-Blown Material…………………………. 400

Figure 157 – Melt-Blown PPE Fabric Manufacturing Plants Market Size [$M] by Scenario – 2020-2024…………………………………………….. 404

Figure 158 – Spun-Bond Manufacturing Method……… 405

Figure 159 – Spun-Bond Based Medical PPE…………. 406

Figure 160 – Spun Bond Manufacturing Machine…….. 407

Figure 161 – Spun-Bond PPE Fabric Manufacturing Plants Market Size [$M] by Scenario – 2020-2024…………………………………………….. 409

Figure 31 – A self-collection PCR sample Kit………….. 410

Figure 162 – Self-collection PCR Test Kits Manufacturing Plants Market Size [$M] by Scenario – 2020-2024…………………………………………….. 412

Figure 163 – Ventilators Production Line………………… 413

Figure 164 – ICU Ventilators per 100,000 People Over 65……………………………………………………. 414

Figure 165 – Ventilators Production Final Test Stage.. 415

Figure 166 – A German Ventilators Production Line…. 416

Figure 167 – Ventilators Manufacturing Plants Market Size [$M] by Scenario – 2020-2024…….. 418

Figure 168 – PCR Reagents Manufacturing Plants Market Size [$M] by Scenario – 2020-2024…….. 420

Figure 169 – PCR Systems Manufacturing Plants Market Size [$M] by Scenario – 2020-2024…….. 422

Figure 170 – Swabs Manufactures Machine……………. 423

Figure 171 – Swabs Manufacturing Plant……………….. 424

Figure 172 – Nose & Mouth Swabs Manufacturing Plants Market Size [$M] by Scenario – 2020-2024……………………………………………………. 427

Figure 173 – Medical Glass & Other Manufacturing Plants Market Size [$M] by Scenario – 2020-2024……………………………………………………. 429

Figure 174 – R&D Equipment & Consumables Market Size [$M] by Scenario – 2020-2024…….. 431

Figure 175 – Medical Glass and Other Products & Services Market Size [$M] by Scenario – 2020-2024……………………………………… 435


[Back to top]

COVID-19 Pandemic Mitigation Products Market – 2020-2024 – Volume 3

Figure 1 – Hospitals and Surge Hospitals Market Size by Region [$M]: Scenario A – 2020-2024…… 15

Figure 2 – Hospitals and Surge Hospitals Market Shares by Region [%]: Scenario A – 2020-2024… 16

Figure 3 – Hospitals and Surge Hospitals Market Size by Region [$M]: Scenario B – 2020-2024…… 16

Figure 4 – Hospitals and Surge Hospitals Market Shares by Region [%]: Scenario B – 2020-2024… 17

Figure 5 – Hospitals and Surge Hospitals Markets Size [$M]: Scenarios A and B – 2020-2024…… 18

Figure 6 – Clinical Labs Market Size by Region [$M]: Scenario A – 2020-2024……………………… 20

Figure 7 – Clinical Labs Market Shares by Region [%]: Scenario A – 2020-2024……………………… 21

Figure 8 – Clinical Labs Market Size by Region [$M]: Scenario B – 2020-2024……………………… 21

Figure 9 – Clinical Labs Market Shares by Region [%]: Scenario B – 2020-2024……………………… 22

Figure 10 – Clinical Labs Market Size [$M]: Scenarios A and B – 2020-2024……………………………. 23

Figure 11 – Clinics Market Size by Region [$M]: Scenario A – 2020-2024………………………………….. 25

Figure 12 – Clinics Market Shares by Region [%]: Scenario A – 2020-2024……………………… 26

Figure 13 – Clinics Market Size by Region [$M]: Scenario B – 2020-2024………………………………….. 27

Figure 14 – Clinics Market Shares by Region [%]: Scenario B – 2020-2024……………………… 27

Figure 15 – Clinics Market Size [$M]: Scenarios A and B – 2020-2024………………………………………. 28

Figure 16 – Emergency Medical Services (EMS) Market Size by Region [$M]: Scenario A – 2020-2024………………………………………………. 30

Figure 17 – Emergency Medical Services (EMS) Market Shares by Region [%]: Scenario A – 2020-2024………………………………………………. 31

Figure 18 – Emergency Medical Services (EMS) Market Size by Region [$M]: Scenario B – 2020-2024………………………………………………. 32

Figure 19 – Emergency Medical Services (EMS) Market Shares by Region [%]: Scenario B – 2020-2024………………………………………………. 32

Figure 20 – Emergency Medical Services Market Size [$M]: Scenarios A and B – 2020-2024…… 33

Figure 21 – Homecare & Nursing Homes Market Size by Region [$M]: Scenario A – 2020-2024…… 35

Figure 22 – Homecare & Nursing Homes Market Shares by Region [%]: Scenario A – 2020-2024… 36

Figure 23 – Homecare & Nursing Homes Market Size by Region [$M]: Scenario B – 2020-2024…… 37

Figure 24 – Homecare & Nursing Homes Market Shares by Region [%]: Scenario B – 2020-2024… 37

Figure 25 – Homecare & Nursing Homes Market Size [$M]: Scenarios A and B – 2020-2024…… 38

Figure 26 – Research Bodies Market Size by Region [$M]: Scenario A – 2020-2024……………………… 40

Figure 27 – Research Bodies Market Shares by Region [%]: Scenario A – 2020-2024……………….. 41

Figure 28 – Research Bodies Market Size by Region [$M]: Scenario B – 2020-2024……………………… 42

Figure 29 – Research Bodies Market Shares by Region [%]: Scenario B – 2020-2024……………….. 42

Figure 30 – Research Bodies Market Size [$M]: Scenarios A and B – 2020-2024…………………………. 43

Figure 31 – North America Vertical Markets’ Size [$M]: Scenario A – 2020-2024……………………… 45

Figure 32 – North America Vertical Markets’ Shares [%]: Scenario A – 2020-2024……………………… 46

Figure 33 – North America Vertical Markets’ Size [$M]: Scenario B – 2020-2024……………………… 47

Figure 34 – North America Vertical Markets’ Shares [%]: Scenario B – 2020-2024……………………… 47

Figure 35 – North America COVID-19 Pandemic Mitigation Market [$]: Scenarios A and B.. 48

Figure 36 – North America Market Shares by Revenue Source [%]: Scenario A – 2020-2024…….. 50

Figure 37 – North America Market Shares by Revenue Source [%]: Scenario B – 2020-2024…….. 52

Figure 38 – Europe Vertical Markets’ Size [$M]: Scenario A – 2020-2024………………………………….. 54

Figure 39 – Europe Vertical Markets’ Shares [%]: Scenario A – 2020-2024……………………… 55

Figure 40 – Europe Vertical Markets’ Size [$M]: Scenario B – 2020-2024………………………………….. 56

Figure 41 – Europe Vertical Markets’ Shares [%]: Scenario B – 2020-2024……………………… 57

Figure 42 – Europe COVID-19 Pandemic Mitigation Market [$]: Scenarios A and B…………….. 57

Figure 43 – Europe Market Shares by Revenue Source [%]: Scenario A – 2020-2024……………….. 59

Figure 44 – Europe Market Shares by Revenue Source [%]: Scenario B – 2020-2024……………….. 60

Figure 45 – Asia-Pacific Vertical Markets’ Size [$M]: Scenario A – 2020-2024……………………… 62

Figure 46 – Asia-Pacific Vertical Markets’ Shares [%]: Scenario A – 2020-2024……………………… 62

Figure 47 – Asia-Pacific Vertical Markets’ Size [$M]: Scenario B – 2020-2024……………………… 63

Figure 48 – Asia-Pacific Vertical Markets’ Shares [%]: Scenario B – 2020-2024……………………… 64

Figure 49 – Asia-Pacific COVID-19 Pandemic Mitigation Market [$]: Scenarios A and B…………….. 64

Figure 50 – Asia-Pacific Market Shares by Revenue Source [%]: Scenario A – 2020-2024…….. 66

Figure 51 – Asia-Pacific Market Shares by Revenue Source [%]: Scenario B – 2020-2024…….. 68

Figure 52 – MEA & Latin America Vertical Markets’ Size [$M]: Scenario A – 2020-2024……………… 70

Figure 53 – MEA & Latin America Vertical Markets’ Shares [%]: Scenario A – 2020-2024…….. 71

Figure 54 – MEA & Latin America Vertical Markets’ Size [$M]: Scenario B – 2020-2024……………… 72

Figure 55 – MEA & Latin America Vertical Markets’ Shares [%]: Scenario B – 2020-2024…….. 72

Figure 56 – MEA & Latin America COVID-19 Pandemic Mitigation Market [$]: Scenarios A and B.. 73

Figure 57 – MEA & Latin America Market Shares by Revenue Source [%]: Scenario A – 2020-2024………………………………………………. 75

Figure 58 – MEA & Latin America Market Shares by Revenue Source [%]: Scenario B – 2020-2024………………………………………………. 77

Figure 59 – U.S. Confirmed Cases per Million Residents by State as of May 26, 2020……………….. 79

Figure 60 – USA Market Size [$M] by Scenario – 2020-2024………………………………………………. 80

Figure 61 – Canada Confirmed Cases per Million Residents by Province/Territory as of May 26, 2020…………………………………………. 82

Figure 62 – Canada Market Size [$M] by Scenario – 2020-2024………………………………………………. 83

Figure 63 – U.K. Confirmed Cases per Ten Thousand Residents as of May 26, 2020…………….. 85

Figure 64 – U.K. Market Size [$M] by Scenario – 2020-2024………………………………………………. 86

Figure 65 – Germany Confirmed Cases per 10,000 Inhabitants by District………………………… 88

Figure 66 – Germany Market Size [$M] by Scenario – 2020-2024………………………………………. 89

Figure 67 – France Deaths per Million Residents by Department……………………………………… 91

Figure 68 – France Market Size [$M] by Scenario – 2020-2024………………………………………………. 92

Figure 69 – Italy Confirmed Cases per Million Residents by Province (as of 25 May 2020)…………. 94

Figure 70 – Italy Market Size [$M] by Scenario – 2020-2024………………………………………………. 95

Figure 71 – Rest of Europe Market Size [$M] by Scenario – 2020-2024…………………………………….. 97

Figure 72 – Map of the Pandemic in India (as of 28 May 2020)……………………………………………… 99

Figure 73 – India Market Size [$M] by Scenario – 2020-2024…………………………………………….. 100

Figure 74 – Confirmed COVID-19 Cases in Mainland China per Million Inhabitants by Province as of 13 April 2020………………………………. 102

Figure 75 – China Market Size [$M] by Scenario – 2020-2024…………………………………………….. 103

Figure 76 – Confirmed Cases per Million Residents by Province or City in South Korea…………. 105

Figure 77 – South Korea Market Size [$M] by Scenario – 2020-2024……………………………………… 106

Figure 78 – Japan Confirmed Cases per Million Residents by Prefecture…………………… 108

Figure 79 – Japan Market Size [$M] by Scenario – 2020-2024…………………………………………….. 109

Figure 80 – Rest of Asia-Pacific Market Size [$M] by Scenario – 2020-2024………………………. 111

Figure 81 – ROW Market Size [$M] by Scenario – 2020-2024…………………………………………….. 113


[Back to top]

COVID-19 Pandemic Mitigation Products Market – 2020-2024 – Volume 4

This volume contains no figures


[Back to top]

COVID-19 Pandemic Mitigation Products Market – 2020-2024 – Volume 5

Figure 1 – Hierarchy of Controls…………………………….. 41

Figure 2 – France National Stockpile of Face Masks….. 56

Figure 3 – Polymerase Chain Reaction Overview………. 73

Figure 4 – Industry Enabled Stabilization of Supply Chain……………………………………………………… 76

Figure 5 – Project Air Bridge………………………………….. 77

Figure 6 – Most Cases are never Counted……………….. 81

Figure 7 – The Difference between A PCR Test and an Antibody Test…………………………………… 90

Figure 8 – Capital Flows to Emerging Markets in Global Shocks………………………………………….. 100

Figure 9 – Depreciation Against the Dollar Since Jan. 1, 2020…………………………………………….. 101


[Back to top]

Questions about this report?

Contact Sales: 1-571-527-1010 or Analysts: 1-202-455-0966

  • Have a question about COVID-19 Pandemic Mitigation Products Market - 2020-2024
    Please fill out all fields in the form below and click "Submit" to send your question.
    Our representative will review your question and contact you with an answer as soon as possible.
  • This field is for validation purposes and should be left unchanged.
1
Interested in this report? Need more information?

You may also like…

X
Powered By